Diagnose the peak-hour delay before adding another shift
Trace a small set of orders through the queue, preparation, and pickup. The same total wait can point to very different operating problems.
View chart data and method
Illustrative event trace, not an observed restaurant order.
hypothetical scenario · minutes
| Scenario / series | Value |
|---|---|
| Queue | 8 |
| Preparation | 6 |
| Ready to handoff | 1 |
Accepted 18:00; started 18:08; physically ready 18:14; handed off 18:15. Intervals=8,6,1; total=15.
Preparation interval includes any interruptions after work starts; it is not a pure hands-on labor measure.
Source references: Original illustrative calculation; not observed results.
A completion button is an event with a definition
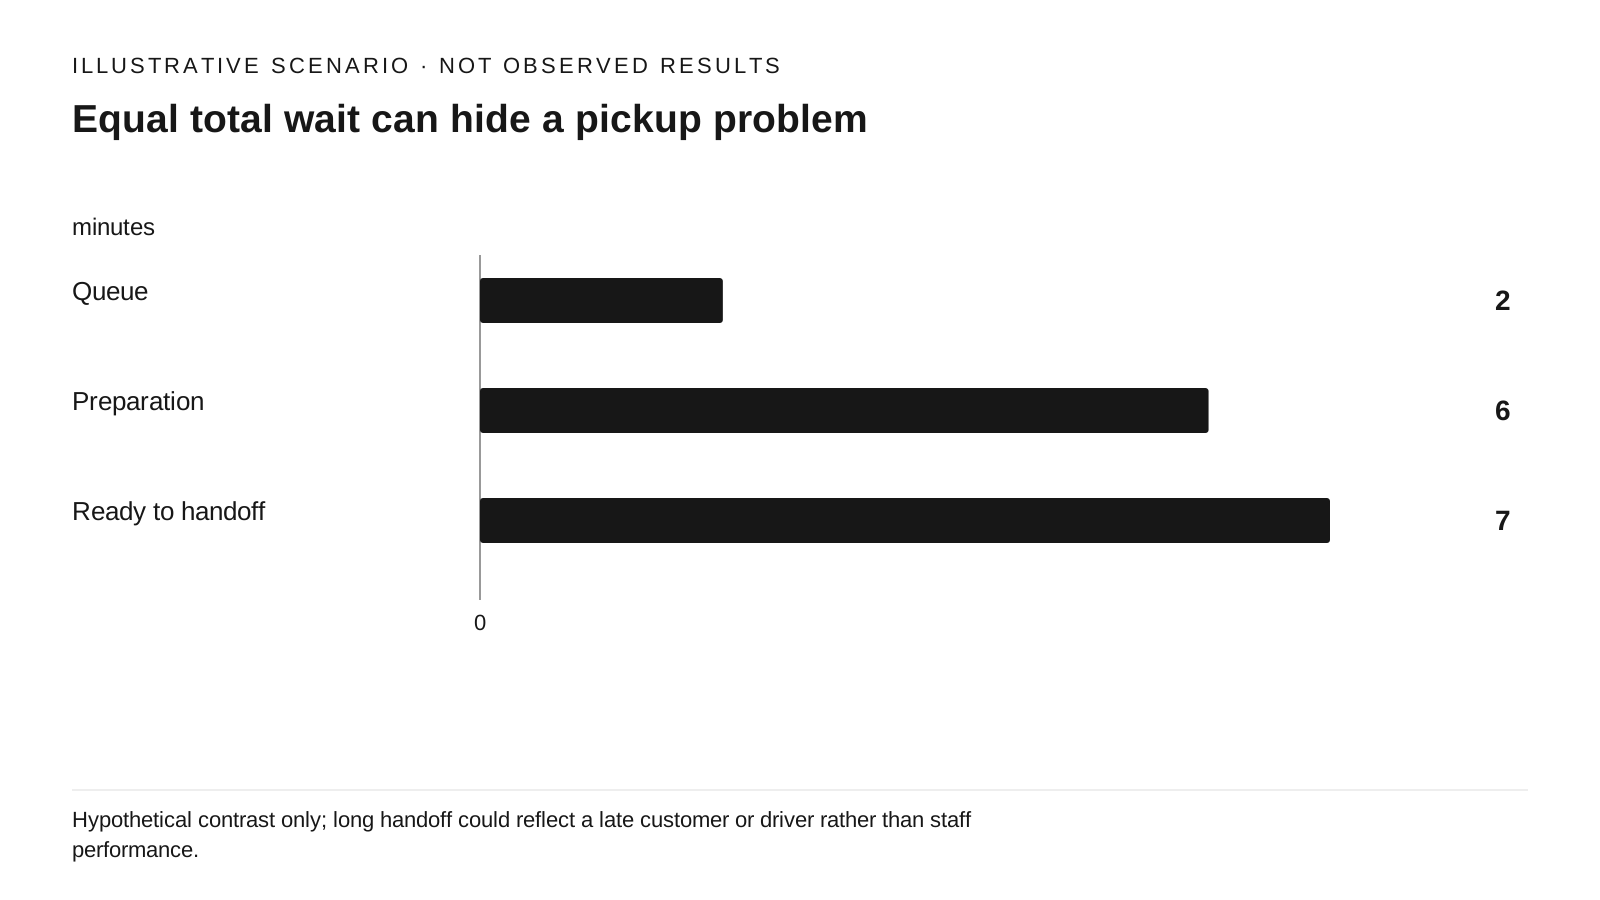
View chart data and method
hypothetical scenario · minutes
| Scenario / series | Value |
|---|---|
| Queue | 2 |
| Preparation | 6 |
| Ready to handoff | 7 |
Accepted 18:00; started 18:02; ready 18:08; handed off 18:15. Intervals=2,6,7; total=15.
Hypothetical contrast only; long handoff could reflect a late customer or driver rather than staff performance.
Source references: Original illustrative calculation; not observed results.
Toast's KDS documentation distinguishes fulfillment at a prep station from fulfillment at an expediter. It also documents two multi-station behaviors: one station can fulfill an item everywhere, or each assigned station must fulfill it independently. These are vendor descriptions, not observations of a particular restaurant. A disappearing ticket therefore needs a configuration-aware interpretation. [S1]
For the proposed investigation, define four moments before collecting data: order accepted, work actually started, complete order physically ready for its next recipient, and order handed over. Use one synchronized clock or a single observer, an anonymized order reference, channel, item count, and a short reason code. Record scheduled orders separately so intentional waiting is not labeled a failure.
Our hypothetical 15-minute order waits eight minutes to start, spends six between start and ready, then one before handoff. Another 15-minute order could spend two, six, and seven minutes in those stages. Adding a cook addresses different possibilities in these two cases; the total alone cannot choose between them.
Observe the queue without turning it into a staff score
Pick a repeatable peak window and capture consecutive eligible orders, rather than only visibly late ones. Retain canceled, remade, and unfinished orders with their status; dropping unfinished orders makes the rush look faster. If observing all orders is impractical, state the sampling rule and how many were missed. Do not collect customer names, phone numbers, or individual employee rankings for this process study.
At short, consistent intervals, count accepted arrivals, completed handoffs, and unfinished orders. If 36 orders arrive and 30 leave during a window, unfinished work increases by six, provided there are no cancellations, transfers, or missing records. That balance identifies growing work in the system, not which station lacks capacity.
Mark large orders, modifier-heavy items, equipment interruptions, batches released by an online channel, and missing components. A queue can grow because arrivals are unusually bunched, one piece of equipment is occupied, or tickets wait for acknowledgment. A staff member who appears idle may be waiting for a prerequisite. The objective is to locate that dependency before assigning blame or cost.
Separate processing constraints from handoff constraints
View chart data and method
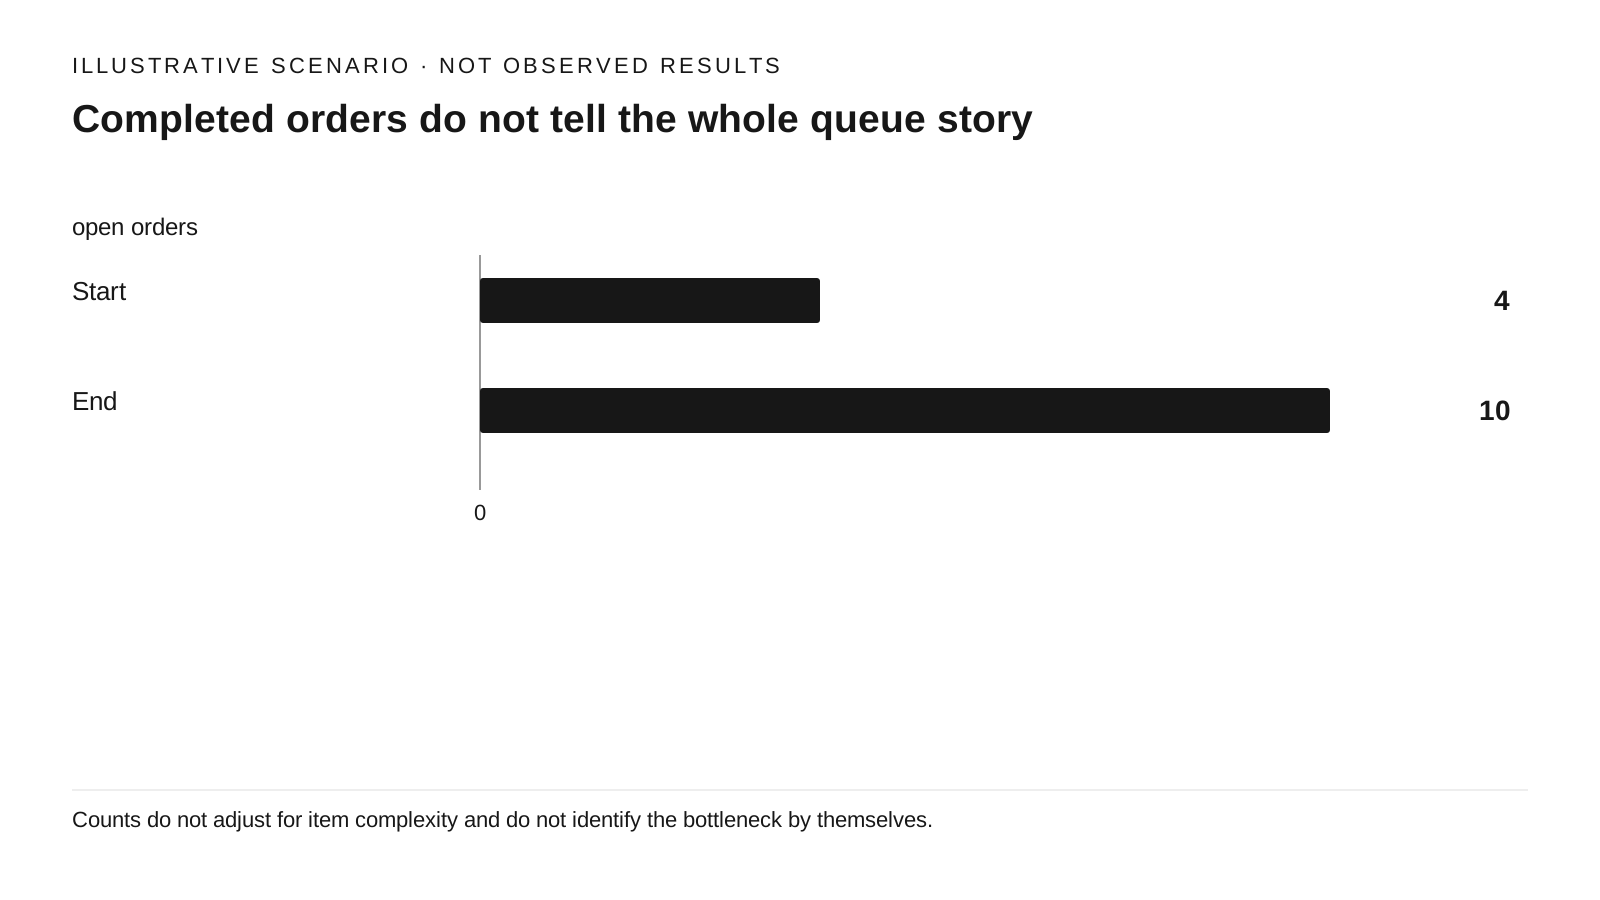
hypothetical scenario · open orders
| Scenario / series | Value |
|---|---|
| Start | 4 |
| End | 10 |
Ending open=4+36−30=10; increase=6
Counts do not adjust for item complexity and do not identify the bottleneck by themselves.
Source references: Original illustrative calculation; not observed results.
If start delays rise when one station has continuous visible work, test whether task capacity is the constraint. If ready food waits while the recipient is present, investigate labeling, assembly, communication, and pickup responsibility. If the customer or driver has not arrived, separate that wait from an internal handoff delay. One category can coexist with another.
Use a simple open-work balance alongside the event traces. In an illustrative 30-minute peak, four orders are already open, 36 arrive, and 30 are handed off, leaving ten open. The increase from four to ten shows why a fast-looking completed subset can be misleading: slow work may still be waiting outside the reported average.
For each stage, report the median and a stated tail measure, such as the slowest 10% threshold, with the count of completed and still-open orders. Define the percentile method and avoid comparing tiny, different samples as if they prove a persistent effect. Keep errors, remakes, and abandoned orders beside time metrics so speed does not conceal quality losses.
Test one explanation and price the next decision
Write a specific hypothesis from the baseline: for example, completed bags wait because no role owns the final handoff. Test an explicit handoff responsibility in comparable service windows, keeping staffing and routing settings stable. Then compare the affected stage, total waits, open work, errors, and workload shifted to other tasks. This is a proposed measurement protocol; no field result has been established here.
If evidence instead points to active task capacity, use the Weekly Labor Budget Planner to price a limited coverage test. Compare both additional cost and whether the predicted stage improves. Extra labor might improve the queue without recovering enough contribution to cover its cost; a handoff fix might merely move a queue upstream. Preserve those outcomes rather than forcing a successful story.
Record the demand mix and unusual events for both periods, and repeat before changing the regular schedule. A rainstorm, a large party, or lighter incoming demand can explain a faster shift. Keep a hypothesis unresolved when the operating conditions or missing timestamps prevent a fair comparison.
Sources & Verified On
Some editorial visuals may be AI-generated and are illustrative, not source evidence.
Verified: 2026-09-24 · Research date and publication date are separate.
- Understanding item fulfillment
Toast · United States English documentation · Public KDS documentation; account/hardware/version not tested
Published: Not stated · Reference period/event: Not applicable / not stated · Retrieved: 2026-09-24
No visible publication date in retrieved page. Settings and device support differ; no restaurant deployment was observed.