Turn a sales forecast into department labor budgets
Subtract fixed labor commitments first, then convert each department's dollars into hours at its own cost. The result is a budget boundary, not a staffing plan.

View chart data and method
Illustrative allocation only: $10,000 forecast sales × 30% = $3,000 total labor budget.
hypothetical scenario · USD per week
| Scenario / series | Value |
|---|---|
| Fixed | 500 |
| Kitchen | 1500 |
| Service | 1000 |
Total=10000×0.30=3000; hourly=3000−500=2500; kitchen=2500×0.60=1500; service=2500×0.40=1000
The 30% target and 60/40 allocation are invented inputs, not industry benchmarks.
Source references: Original illustrative calculation; not observed results.
Match the report to the decision
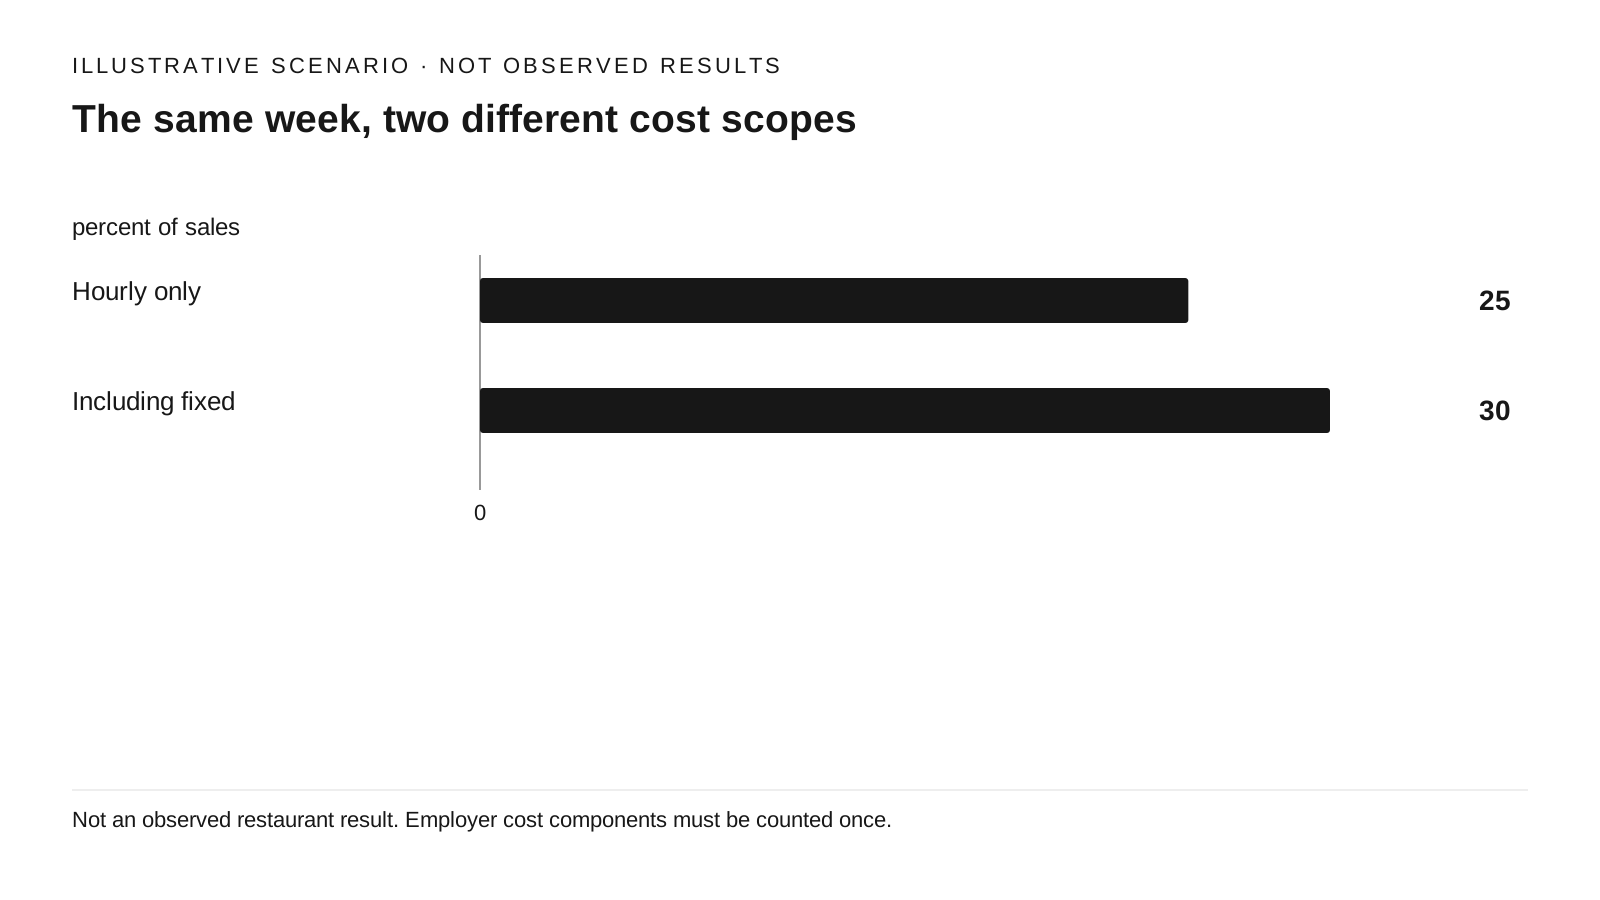
View chart data and method
hypothetical scenario · percent of sales
| Scenario / series | Value |
|---|---|
| Hourly only | 25 |
| Including fixed | 30 |
2500/10000×100=25; (2500+500)/10000×100=30
Not an observed restaurant result. Employer cost components must be counted once.
Source references: Original illustrative calculation; not observed results.
Start with next week's expected net food and beverage sales, excluding sales tax and tips. Use the same seven dates for sales and labor. Select a labor target that fits your own financial plan; the 30% used here is an illustration, not a recommended operating standard. Record which discounts and refunds reduce your sales denominator so a later comparison means the same thing.
A labor report can cover less than the budget you are trying to control. Toast's Labor Cost Breakdown documentation, updated June 23, 2026, allows either net or gross sales as the denominator and says its labor calculation excludes salaried jobs. That is a documented feature of this report, not evidence about every POS or your account configuration. Verify your own report's scope before copying its percentage into a total-labor budget. [S1]
In the example, $2,500 of hourly labor divided by $10,000 of sales looks like 25%. Adding $500 of fixed labor makes total labor 30%. Both percentages can be arithmetically correct while answering different questions. An apparent improvement can come from omitted costs, changed sales definitions, or price increases, rather than more productive staffing.
Reserve fixed costs before assigning hours
Total labor budget equals expected sales multiplied by the target percentage. Subtract the week's allocated salaries and other fixed labor costs. Then assign the remaining dollars to departments. In our example, $10,000 × 30% − $500 = $2,500. A chosen 60% kitchen share and 40% service share produce $1,500 and $1,000 respectively.
Use a department's expected hourly employer cost, including the burden components you have verified for your operation. At $30 per hour, the kitchen allocation buys 50 budget hours. At $20 per hour, the service allocation buys 50. Equal hours happen here because different dollar allocations offset different hourly costs; dividing both departments by one blended wage would hide that relationship.
Keep a short input ledger: item, amount, period, included cost components, and source. Enter a fixed salary allocation once. Include an expected overtime premium either in a clearly adjusted hourly cost or as an explicit additional expense, never in both. This arithmetic does not calculate lawful pay, taxes, overtime eligibility, or minimum staffing.
Stress the forecast before writing the schedule
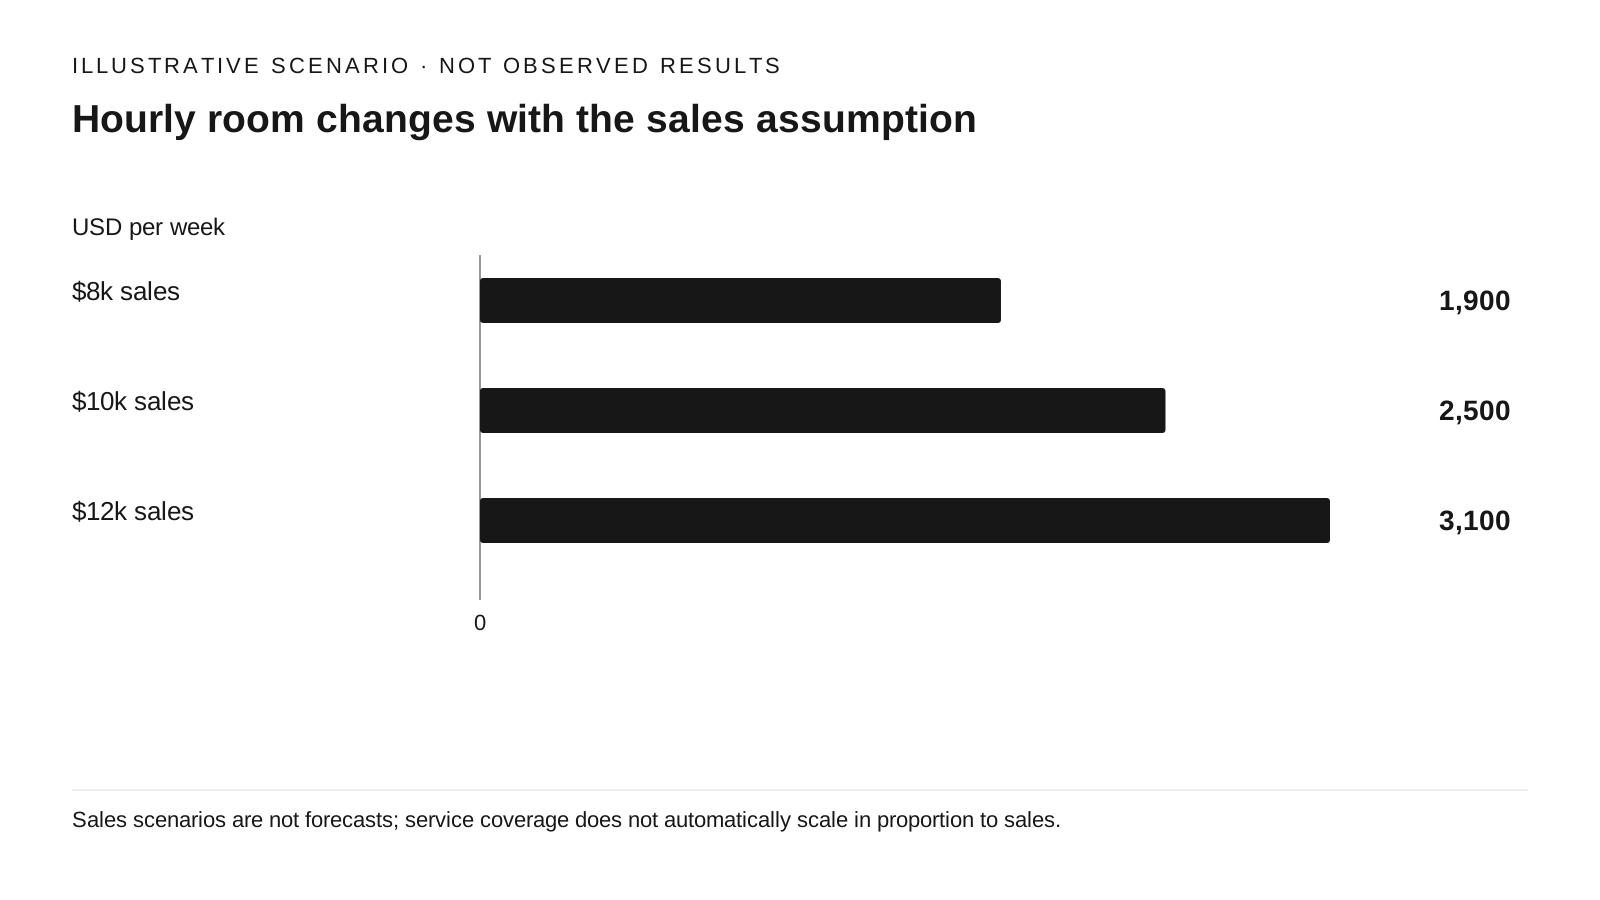
View chart data and method
hypothetical scenario · USD per week
| Scenario / series | Value |
|---|---|
| $8k sales | 1900 |
| $10k sales | 2500 |
| $12k sales | 3100 |
Hourly budget=forecast sales×0.30−500
Sales scenarios are not forecasts; service coverage does not automatically scale in proportion to sales.
Source references: Original illustrative calculation; not observed results.
Hold the $500 fixed allocation and 30% target constant. At $8,000, $10,000, and $12,000 in weekly sales, the hourly budget becomes $1,900, $2,500, and $3,100. Those are scenarios, not sales forecasts. They show how much of the apparent room for hours depends on the sales assumption.
Now price the actual proposed coverage separately. Suppose the kitchen needs 55 hours at $30 and service needs 55 hours at $20. Hourly labor costs $2,750, and total labor including fixed pay costs $3,250. Against the middle scenario, the plan is $250 above target. The useful question is what creates that gap: an optimistic target, unavoidable opening work, a sales shortfall, a more expensive skill mix, or overlap that serves no clear purpose.
A negative hourly remainder means the target cannot cover the entered fixed commitments. It is not an instruction to remove staff. Keep opening, closing, training, service requirements, and operational constraints visible when evaluating a budget that does not fit.
Reconcile one week before changing the next
Use the Weekly Labor Budget Planner to enter daily sales expectations, fixed allocations, departmental costs, and planned hours. Save the assumptions with a week label. At week end, compare planned hours with actual paid hours and compare forecast net sales with actual net sales using the same definitions. Keep private employee records in your existing controlled systems; this exercise only needs department totals.
Split the dollar variance into volume, rate, and fixed-cost effects. For each department, (actual hours − planned hours) × planned hourly cost isolates the hours effect; actual hours × (actual hourly cost − planned hourly cost) isolates the rate effect. Add the actual-minus-planned fixed-cost difference. The components reconcile to actual labor dollars minus planned labor dollars when the cost definitions match.
Use that reconciliation to revise one input or coverage assumption. Also inspect ticket delays, unfinished closing work, and missed service tasks. A lower labor percentage accompanied by a worse guest experience is not proof of a better schedule. The planner supplies transparent arithmetic; your operating observations determine whether the plan can work.
Sources & Verified On
Some editorial visuals may be AI-generated and are illustrative, not source evidence.
Verified: 2026-09-24 · Research date and publication date are separate.
- Labor Cost Breakdown Report Overview
Toast · United States · Public documentation; no account or plan tested
Published: Not stated · Reference period/event: Documentation last updated 2026-06-23; original publication date unknown · Retrieved: 2026-09-24
Vendor documentation, not observed account behavior. Report settings and cost inclusions need local confirmation; no payroll compliance conclusion.