How many extra paid visits must a loyalty reward earn?
Start with all rewards paid, then ask how many genuinely additional orders can cover them. A busy loyalty dashboard cannot answer that question by itself.

Price the reward against contribution, not the check
View chart data and method
hypothetical scenario · USD net contribution change
| Scenario / series | Value |
|---|---|
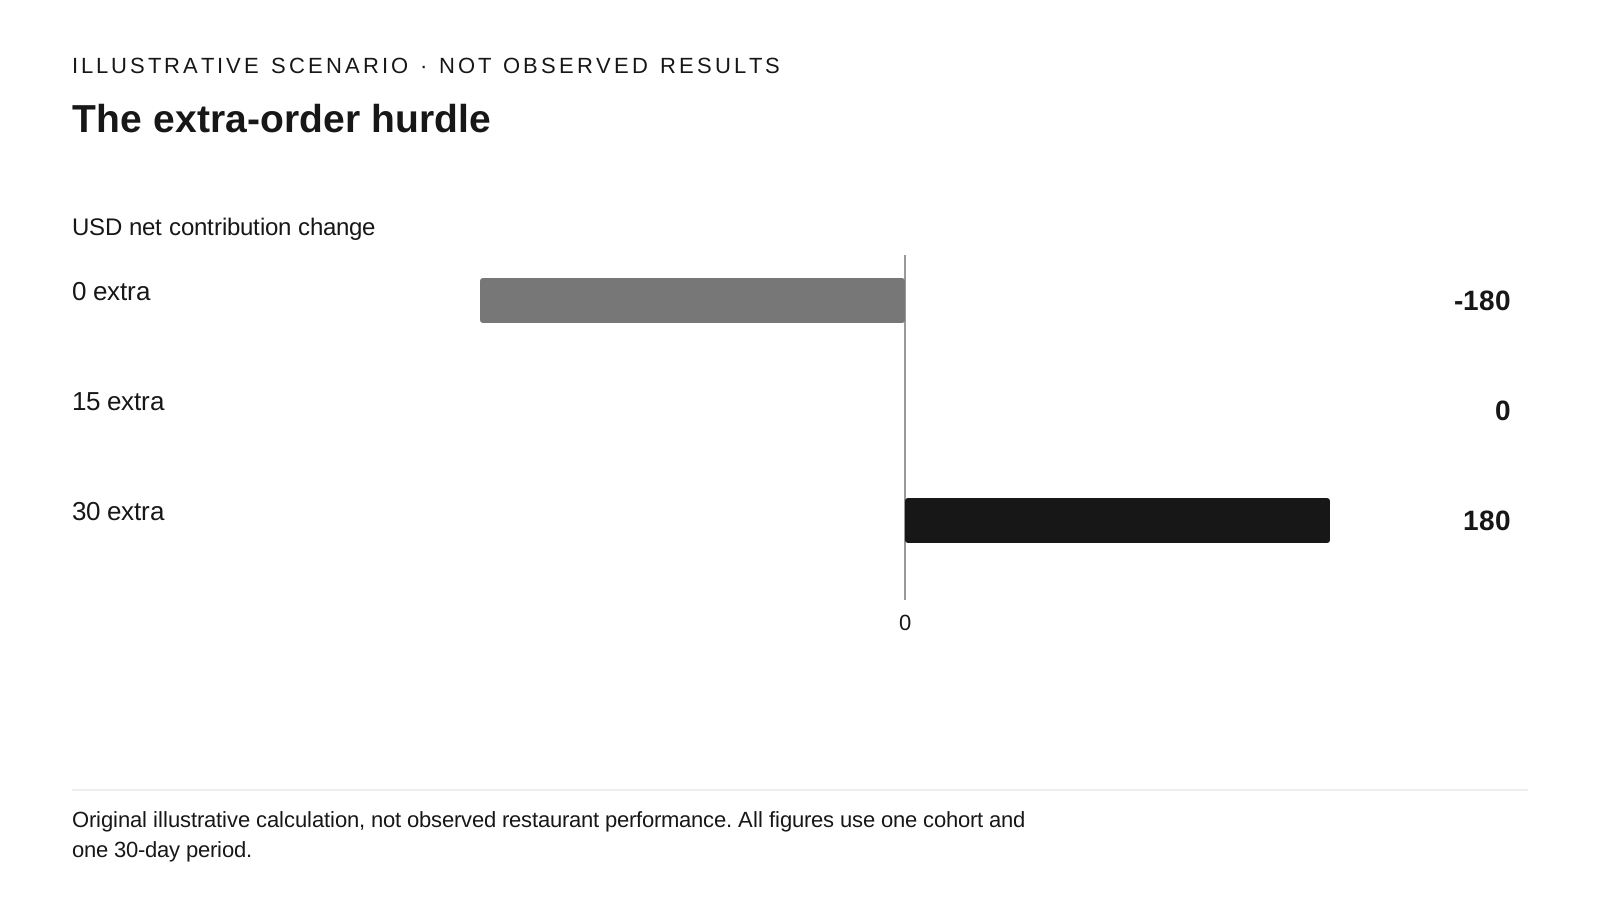
| 0 extra | -180 |
| 15 extra | 0 |
| 30 extra | 180 |
additional paid orders*12-150-30
Original illustrative calculation, not observed restaurant performance. All figures use one cohort and one 30-day period.
Source references: Original illustrative calculation; not observed results.
A reward is affordable when the extra contribution it creates covers the contribution it gives away and the cost of running it. Unit contribution is price less variable cost; it is available to cover fixed expenses before profit. [S1] A $20 check is therefore not $20 available to fund rewards.
Square's reporting documentation lists visits, member-versus-nonmember spending, and sales attributed to promotions. [S2] Those are useful operating observations. We interpret them as a starting point for measurement, not proof that membership caused spending. A frequent guest may join precisely because they already visit often.
For an original 30-day scenario, hold the customer cohort constant. Assume 100 paid orders without the program, 130 with it, and $12 contribution per paid order before rewards. If total reward burden is $150 and program costs are $30, the difference is (130 − 100) × $12 − $150 − $30 = $180. These are illustrative inputs, not measured performance.
A free item and a cash discount have different economics
Define reward burden D as the total reduction in contribution caused by all rewards during the period, including rewards used by guests who would have ordered anyway. A cash discount generally removes that much sale revenue, with any associated fee savings accounted for consistently. A free add-on instead requires its incremental ingredient, packaging, and handling costs.
There is also substitution. A complimentary side that would otherwise have been purchased can replace paid sales. For illustration, a side costs $1.20 to produce and sells for $4. If the customer would have bought no side, supplying it costs $1.20. If the same side would otherwise have been bought at $4, giving it free reduces contribution by $4 relative to that paid-sale counterfactual. Do not add both $4 and $1.20 for that same side.
The split between those cases is unknown without evidence. Record a low-substitution and high-substitution scenario. Do not use the menu price of every free item as its automatic cost, or assume every giveaway displaces a paid sale. A reward-only pickup is not an additional paid order.
A lower-margin visit raises the recovery hurdle
View chart data and method
hypothetical scenario · additional paid orders
| Scenario / series | Value |
|---|---|
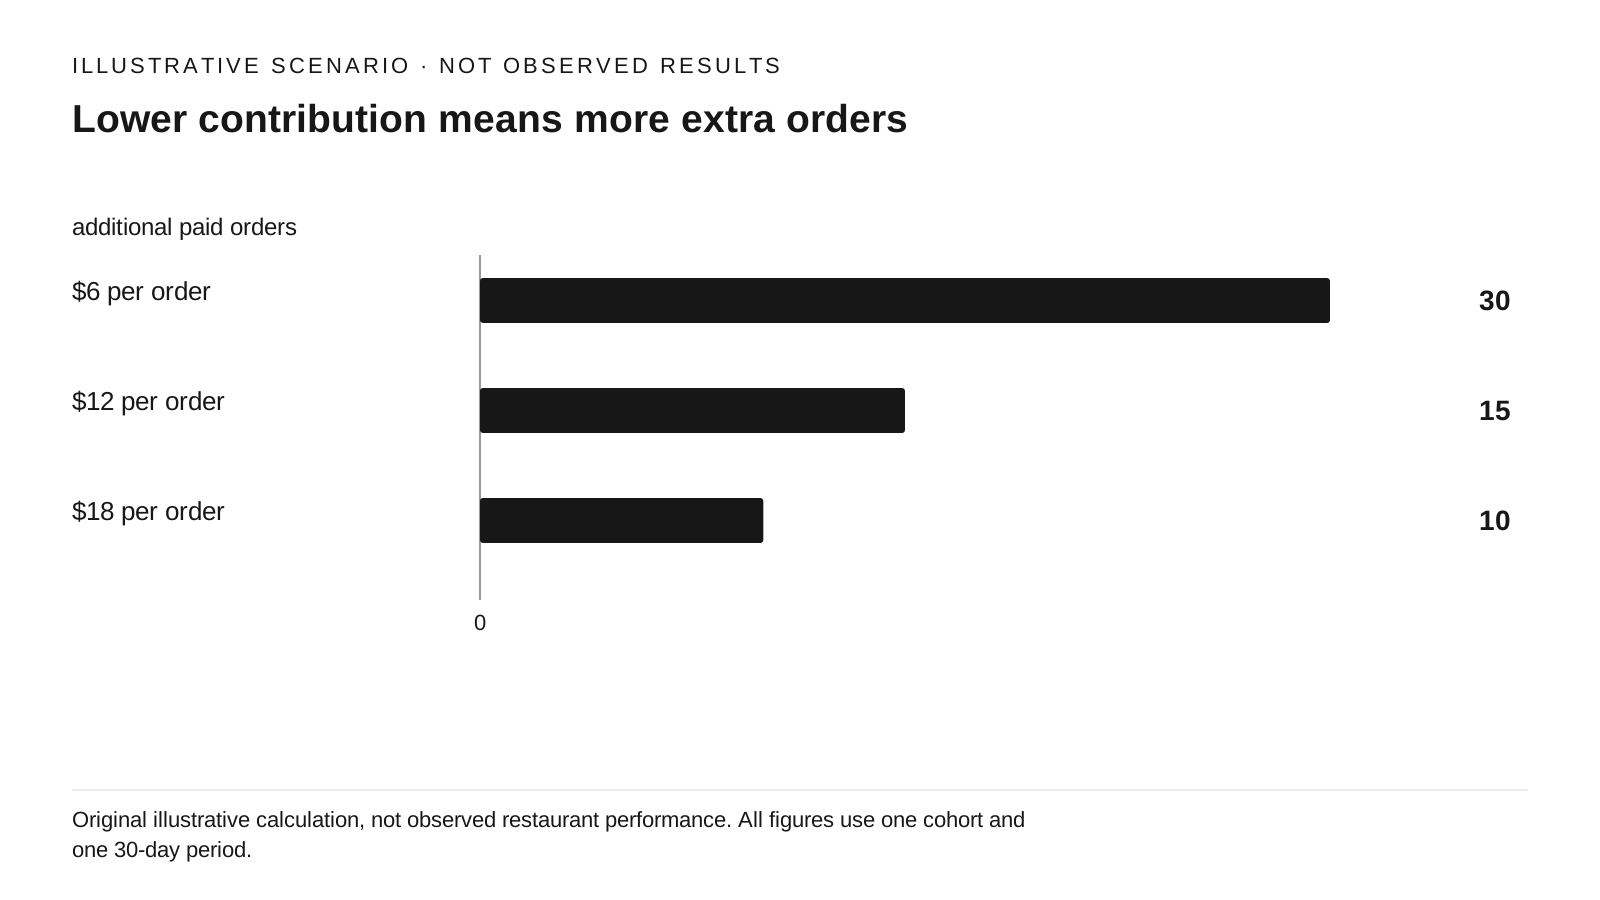
| $6 per order | 30 |
| $12 per order | 15 |
| $18 per order | 10 |
ceil(180/m), for m=6,12,18
Original illustrative calculation, not observed restaurant performance. All figures use one cohort and one 30-day period.
Source references: Original illustrative calculation; not observed results.
When m is positive, the minimum whole number of additional paid orders is ceil((D + K) ÷ m). With $180 of combined burden, recovery takes 30 extra orders at $6 contribution, 15 at $12, or 10 at $18. The hurdle is driven by what an incremental order leaves behind, not the number of enrolled members.
Using one average m assumes that extra orders have the same contribution as the modeled average. That can fail if a promotion attracts small checks, changes delivery mix, or pushes work into an overtime shift. Model those orders separately or revise m and K. Keep base contribution before rewards so that the same discount is not deducted twice.
A program can also move a purchase forward instead of creating another purchase. A profitable-looking launch week followed by a quieter week may be timing substitution. Extend the observation period to include the expected next purchase cycle before calling the change durable. If m is zero or negative and program burden is positive, more identical orders cannot recover that burden.
Use a range before deciding to expand
Build a short reward ledger before using the Repeat Visit & Loyalty Economics Calculator: cohort and dates; paid orders; contribution before rewards; cash discounts; free-item costs; suspected substituted sales; software, message, and extra operating costs. Exclude tax and tips from food revenue. Record refunds consistently in both order counts and contribution.
Run a conservative baseline, a middle case, and an optimistic case. In this example, P=130 but B=120 gives only $120 of extra-order contribution and a $60 loss after program costs. P=130 and B=100 produces $180. The dashboard can show the same 130 paid orders in both cases; the unobserved baseline changes the decision.
Use the calculator to find the economic hurdle, then use LG-03 to design a comparison that can investigate the baseline. Expand only when the evidence supports enough additional contribution, the result survives a plausible substitution scenario, and service has capacity. Otherwise change the reward, narrow the audience, or continue a limited measurement period rather than declaring the program successful from redemption volume.
Sources & Verified On
Some editorial visuals may be AI-generated and are illustrative, not source evidence.
Verified: 2026-09-24T02:44:57Z · Research date and publication date are separate.
- Contribution margin per unit, ratio, and total
OpenStax, Rice University · United States; general accounting principles
Published: 2019-02-14 · Reference period/event: Not applicable / not stated · Retrieved: 2026-09-24T02:44:57Z
General accounting reference, not a restaurant loyalty experiment. No textbook figures, worked examples, or extended text reused.
- View loyalty reporting
Square · United States · Support page retrieved 2026-09-24; no version date displayed
Published: Not stated · Reference period/event: Not applicable / not stated · Retrieved: 2026-09-24T02:44:57Z
Vendor documentation describes reports, not causal evidence of incremental visits. Page does not show a publication or revision date.