Which promotion orders would have happened anyway?
A randomized holdout can estimate an offer's incremental effect. Redemption counts and before-and-after sales cannot supply the missing comparison on their own.

View chart data and method
Illustrative: 200 guests assigned to each arm over the same period. The 0.15 difference is a point estimate, not an established effect.
hypothetical scenario · paid orders per assigned guest
| Scenario / series | Value |
|---|---|
| No-offer group | 0.5 |
| Offer group | 0.65 |
100/200=0.50;130/200=0.65;difference=0.15
Original hypothetical experiment. No guests were assigned and no campaign was run. No statistical significance is claimed.
Source references: Original illustrative calculation; not observed results.
The missing number is a counterfactual
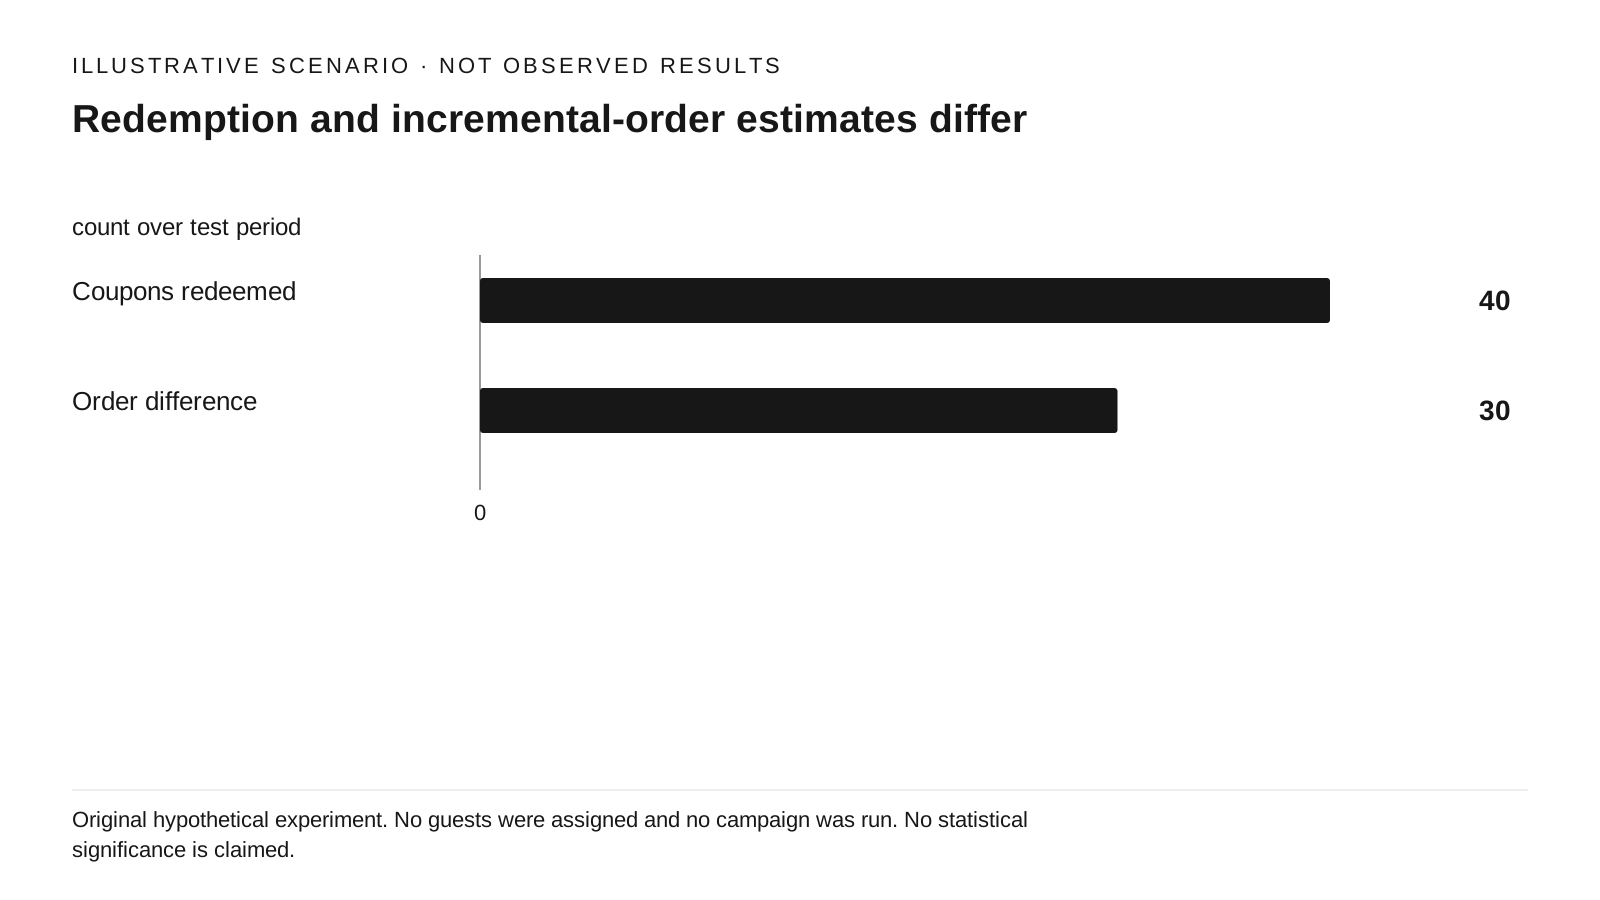
View chart data and method
hypothetical scenario · count over test period
| Scenario / series | Value |
|---|---|
| Coupons redeemed | 40 |
| Order difference | 30 |
40 assumed redemptions;130-100=30 order difference
Original hypothetical experiment. No guests were assigned and no campaign was run. No statistical significance is claimed.
Source references: Original illustrative calculation; not observed results.
A redeemed coupon tells you an offer was used. It does not tell you whether the guest would have bought at the regular price, ordered tomorrow, or switched from another channel. The decision needs a comparison with what those eligible guests would have done without this offer.
NIST's experimental-design guidance describes random assignment of treatment levels to experimental units. [S1] We propose adapting that principle to an eligible guest list: assign some guests to receive the offer and some to a no-offer holdout before anyone receives it. Run both groups during the same dates. This is a measurement design, not an experiment we have carried out.
In an illustrative test, 200 assigned guests in each group generate 130 paid orders with the offer and 100 without it. The observed difference is 0.15 orders per assigned guest, or 30 orders across the 200-person offer arm. If 40 coupons were redeemed, those redemptions still would not mean 40 additional orders. The comparison uses all eligible outcomes, including people who never open or redeem the offer.
Protect the comparison before launching it
Write the eligibility rule, dates, offer, primary outcome, and stopping rule first. An example primary outcome is total contribution per assigned guest during the offer window plus a specified follow-up period. Order count is a useful secondary outcome. Do not keep changing the main metric until one looks favorable.
Randomize comparable guests within a few meaningful groups if needed, such as recent regulars and lapsed guests. NIST describes blocking as a way to account for selected nuisance factors. [S2] Make the offer and holdout shares the same within each group or use the prespecified group weights when combining results.
Choose an assignment unit that limits leakage. Household members sharing a coupon may need one assignment. If whole locations or days receive the offer, locations or days—not individual receipts—are the independent assignment units. A two-location comparison has two units, even if it includes thousands of orders. Record code-sharing, overlapping campaigns, delivery-channel identity gaps, and service disruptions.
Convert the estimate to contribution, with uncertainty attached
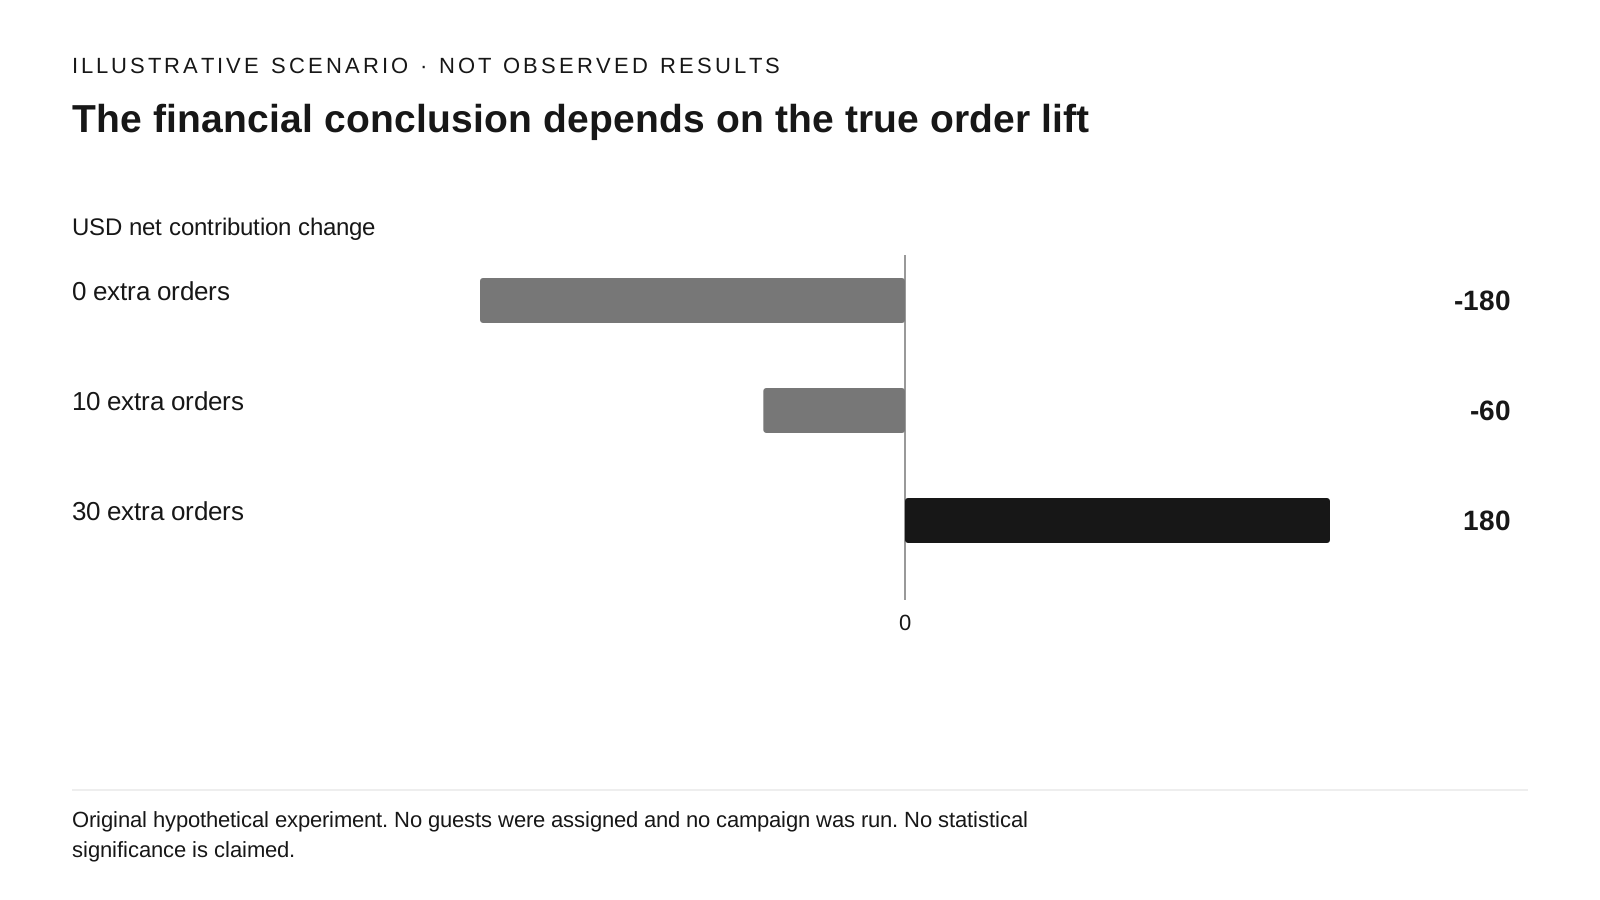
View chart data and method
hypothetical scenario · USD net contribution change
| Scenario / series | Value |
|---|---|
| 0 extra orders | -180 |
| 10 extra orders | -60 |
| 30 extra orders | 180 |
extra orders*12-150-30
Original hypothetical experiment. No guests were assigned and no campaign was run. No statistical significance is claimed.
Source references: Original illustrative calculation; not observed results.
The same 30-order point estimate can be financially strong or weak. At $12 contribution before rewards, $150 total reward burden, and $30 program cost, the illustrative net change is $180. At only ten additional orders, it is −$60. At zero, it is −$180. Reward costs include discounts given to guests who would have purchased anyway.
This simplified conversion assumes stable contribution per extra order. Prefer comparing actual contribution per assigned guest directly when checks, menu mix, channel fees, or labor costs change. Count all linked channels so that migration from direct ordering to a discounted channel is not automatically recorded as new demand.
A point estimate needs an uncertainty range appropriate to the assignment design. Per-guest order or contribution variability, sample size, repeated purchases, and any household/location grouping affect that range. The aggregate illustration lacks those records, so no confidence interval or statistical significance is supplied. If the plausible range spans a material loss and a worthwhile gain, the test has not resolved the decision.
Make the first test a bounded learning decision
Use the LG-01 calculator first to identify the smallest improvement worth detecting. Then assess whether the reachable guest sample and outcome variability can distinguish that improvement. A large mailing list with only a few purchases may still be uninformative. Get appropriate statistical support for sample planning or grouped assignment instead of choosing a sample size from a universal rule of thumb.
Keep the original assignments in the analysis, including people who ignored the message. Observe a prespecified later period to check whether purchases were merely pulled forward. Also record refunds, complaints, queue times, and the total cost of the offer; a contribution increase that depends on unrecorded service costs is incomplete.
If a randomized holdout is unavailable, compare similar periods and customer groups while recording seasonality, price changes, and other promotions. Label that evidence observational. It can suggest a next test but cannot rule out competing explanations. Expand only when the financial result, uncertainty, and operating limits support it; otherwise report an inconclusive result and the evidence needed to resolve it.
Sources & Verified On
Some editorial visuals may be AI-generated and are illustrative, not source evidence.
Verified: 2026-09-24T02:44:57Z · Research date and publication date are separate.
- Engineering Statistics Handbook: Completely randomized designs
NIST/SEMATECH · General methodology
Published: Not stated · Reference period/event: Not applicable / not stated · Retrieved: 2026-09-24T02:44:57Z
General experimental design guidance; no restaurant promotion effect estimated.
- Engineering Statistics Handbook: Randomized block designs
NIST/SEMATECH · General methodology
Published: Not stated · Reference period/event: Not applicable / not stated · Retrieved: 2026-09-24T02:44:57Z
Our application to restaurant guest groups is a proposed design, not an executed experiment.