Measure the second visit with a cohort, not a monthly repeat share
Give each first-time guest the same chance to return, state who you can identify, and keep customer mix separate from retention.

View chart data and method
Illustrative: 120 guests have a full 30-day window and 36 return. Adding 80 later arrivals with no observed second visit yet creates an unfair 18% comparison.
hypothetical scenario · percent
| Scenario / series | Value |
|---|---|
| Complete follow-up | 30 |
| Mixed with new arrivals | 18 |
36/120*100=30; 36/(120+80)*100=18
Original illustration, not restaurant observations or an industry benchmark.
Source references: Original illustrative calculation; not observed results.
Decide what your records can actually observe
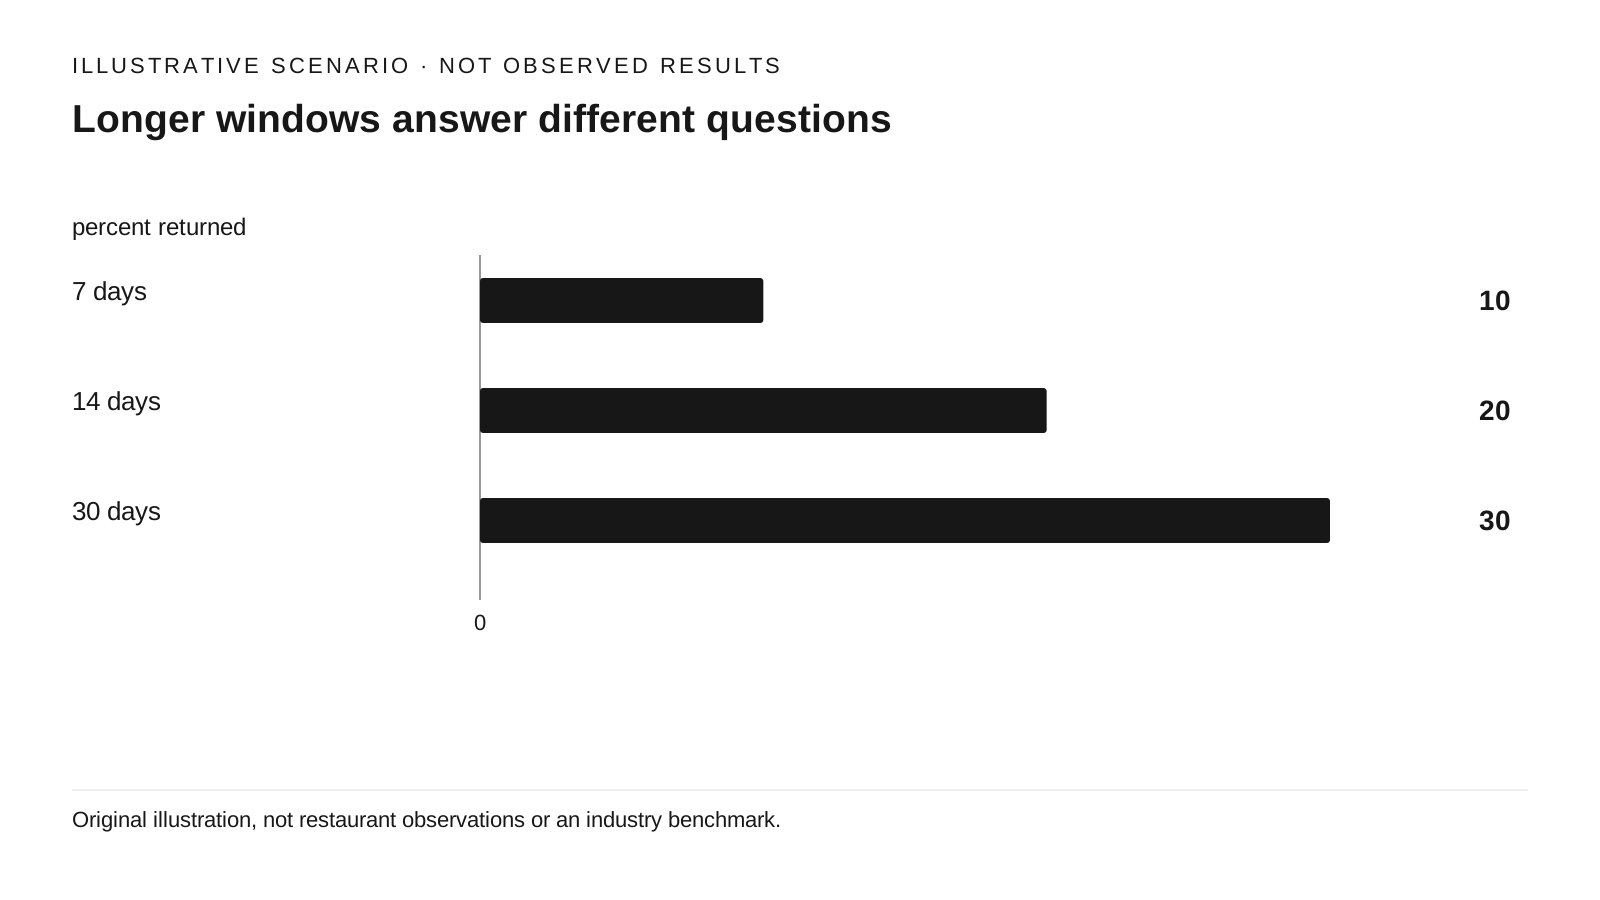
View chart data and method
hypothetical scenario · percent returned
| Scenario / series | Value |
|---|---|
| 7 days | 10 |
| 14 days | 20 |
| 30 days | 30 |
12/120*100=10;24/120*100=20;36/120*100=30
Original illustration, not restaurant observations or an industry benchmark.
Source references: Original illustrative calculation; not observed results.
A monthly repeat-customer share answers who appeared this month. A first-to-second-visit rate asks what happened after a defined first visit. They can move differently: a restaurant can attract many new guests and dilute its repeat share even while each acquisition cohort returns at the same rate.
The fields behind a dashboard matter. Square's US customer-insights documentation says its insights use credit and debit card transactions and exclude cash. [S1] That is an example of a coverage boundary, not a criticism or a universal description of POS systems. Verify your own product's definitions before comparing its number with a hand-built cohort.
Our proposed record has a privacy-preserving customer identifier, first observed paid-visit timestamp, next qualifying paid-visit timestamp, location/channel, and an observation end date. Work with an authorized local export; do not upload guest identities to a public calculator. Choose whether multiple payments in one dining occasion count as one visit, then keep the rule stable.
Wait for the cohort's window to close
Select a first-visit cohort, such as guests whose first observed paid visit occurred during a named calendar week. Select a horizon that fits your dining occasion, such as 30 days. For a simple mature-cohort rate, include only guests whose observation end is at least 30 days after that first visit. Count how many make a qualifying second paid visit within those 30 days.
NIST describes censoring as a situation where an event beyond the end of observation has not been seen. [S2] We adapt that idea here: a guest who first arrived three days ago has not failed a 30-day return test. Keep that guest in a pending cohort, even if some newer guests have already returned. Including only early returners from incomplete cohorts would bias the rate upward.
Freeze the extraction date and use one time zone. Report the first-visit period, follow-up horizon, number eligible, number returned, and pending count. If the system was installed recently, a supposedly new person might be a long-standing regular missing from the historical record. Label the result first observed return conversion and disclose how far back you searched.
Separate a mix change from a relationship change
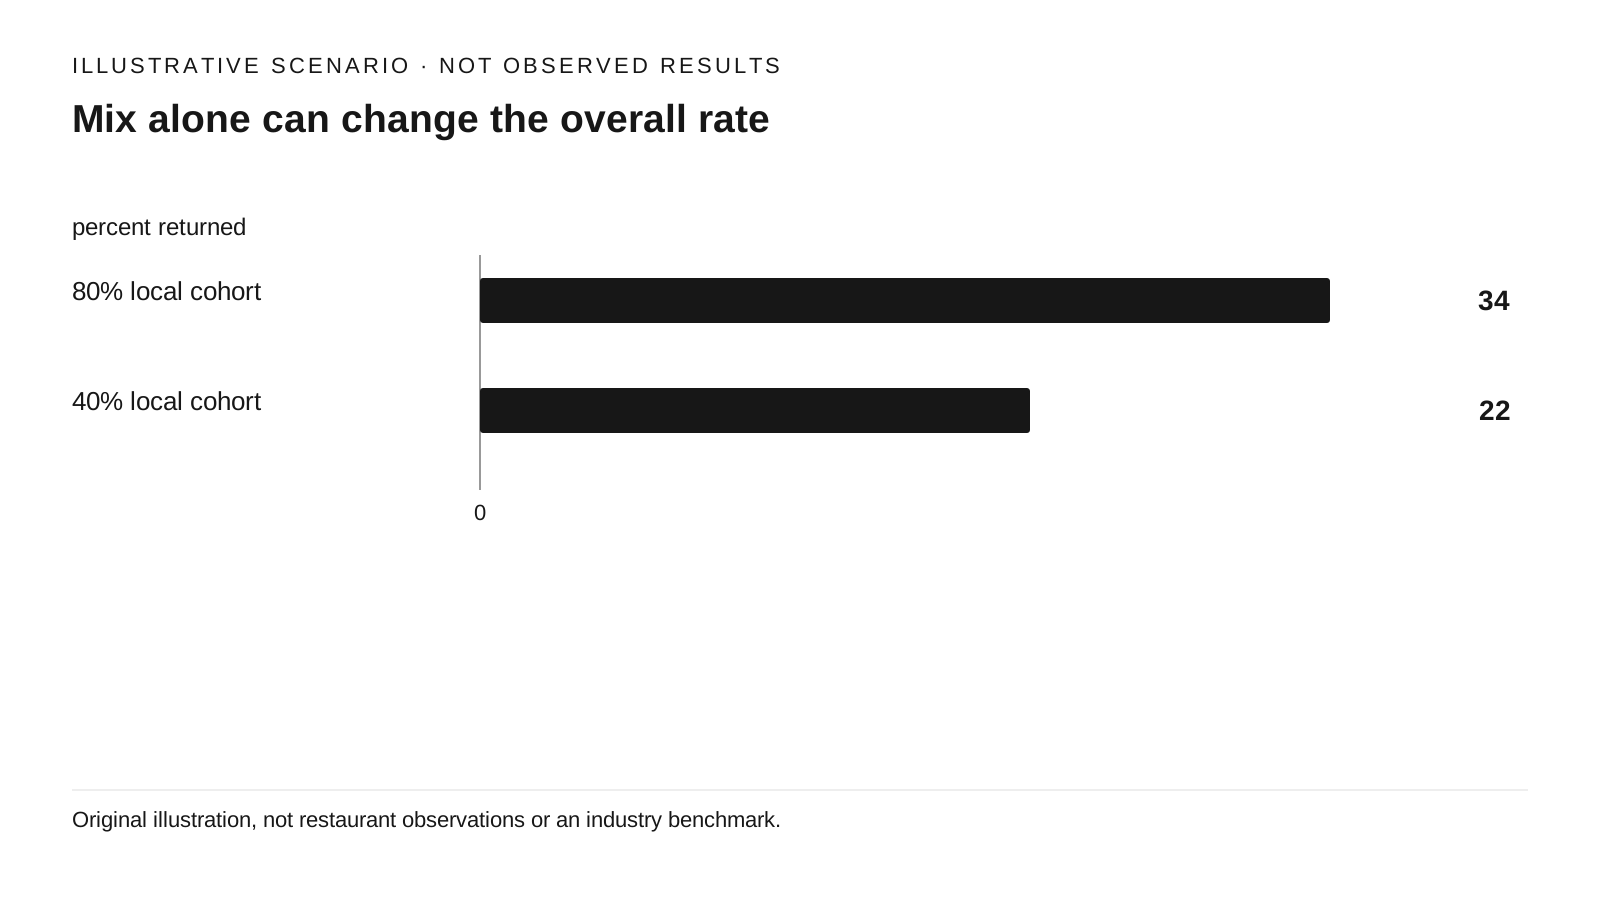
View chart data and method
hypothetical scenario · percent returned
| Scenario / series | Value |
|---|---|
| 80% local cohort | 34 |
| 40% local cohort | 22 |
0.8*40+0.2*10=34;0.4*40+0.6*10=22
Original illustration, not restaurant observations or an industry benchmark.
Source references: Original illustrative calculation; not observed results.
Consider an original illustration with local diners returning at 40% within 30 days and visitors returning at 10%. A cohort that is 80% local yields 34% overall. Another cohort that is 40% local yields 22%. Neither subgroup changed; only the mixture did. The twelve-point fall cannot, by itself, establish worse service or a failed campaign.
Compare like with like where the sample supports it: acquisition source, first-visit channel, dining occasion, or location. Avoid slicing into dozens of tiny groups that produce unstable percentages. A small restaurant may learn more from the next several complete cohorts than from a very granular dashboard.
Identity loss can also move the rate. One person switching cards may appear new, a shared identifier may merge people, and a return through an unlinked marketplace may disappear. Track the share of orders that can be linked and any changes in capture practice alongside the conversion rate. An improved identification process can resemble improved retention.
Publish a small, reproducible cohort scorecard
Start with a written definition: one identified guest; first observed paid dining occasion; second separate paid occasion within 30 days; refunds and voids handled consistently; all participating locations included. Decide whether a same-day second order is a new occasion. A free reward pickup alone does not meet a paid-visit definition.
For each weekly cohort, keep the raw numerator and denominator next to the percentage. In the 36-of-120 illustration, write 36/120, 30%, full 30-day follow-up, plus the 80 guests whose follow-up is still pending. Keep a separate coverage note for unlinked transactions; do not invent the missing customers' return behavior.
Use this scorecard to locate a question worth testing, such as whether new pickup guests return less often than comparable dine-in guests. It cannot establish why they differ. Investigate service records and acquisition mix, then test one change with a suitable comparison. LG-03 explains the causal step, while LG-01 translates genuinely additional visits into economics.
Sources & Verified On
Some editorial visuals may be AI-generated and are illustrative, not source evidence.
Verified: 2026-09-24T02:44:57Z · Research date and publication date are separate.
- Use customer insights
Square · United States · Support page retrieved 2026-09-24; no revision date displayed
Published: Not stated · Reference period/event: Not applicable / not stated · Retrieved: 2026-09-24T02:44:57Z
Product documentation, not a general restaurant benchmark. The report is not itself a first-to-second-visit cohort analysis.
- Engineering Statistics Handbook: Censoring
NIST/SEMATECH · General methodology
Published: Not stated · Reference period/event: Not applicable / not stated · Retrieved: 2026-09-24T02:44:57Z
Reliability-testing examples; adaptation to visits is our proposed measurement method, not a validated restaurant model.