When food and labor costs move in different directions
Separate invoice price, usable yield, paid hours, and hourly cost before deciding whether a headline improves your margin.

View chart data and method
Illustrative weekly baseline: food $3,000, labor $3,200. Food falls 4%; labor rises 5%.
hypothetical scenario · USD cost change
| Scenario / series | Value |
|---|---|
| Food | -120 |
| Labor | 160 |
| Combined | 40 |
3000×(-0.04)=-120; 3200×0.05=160; -120+160=40.
Fixed volumes, recipes, hours and staffing mix; rates chosen for illustration, not current market data.
Source references: Original illustrative calculation; not observed results.
Use external indexes to choose what to check
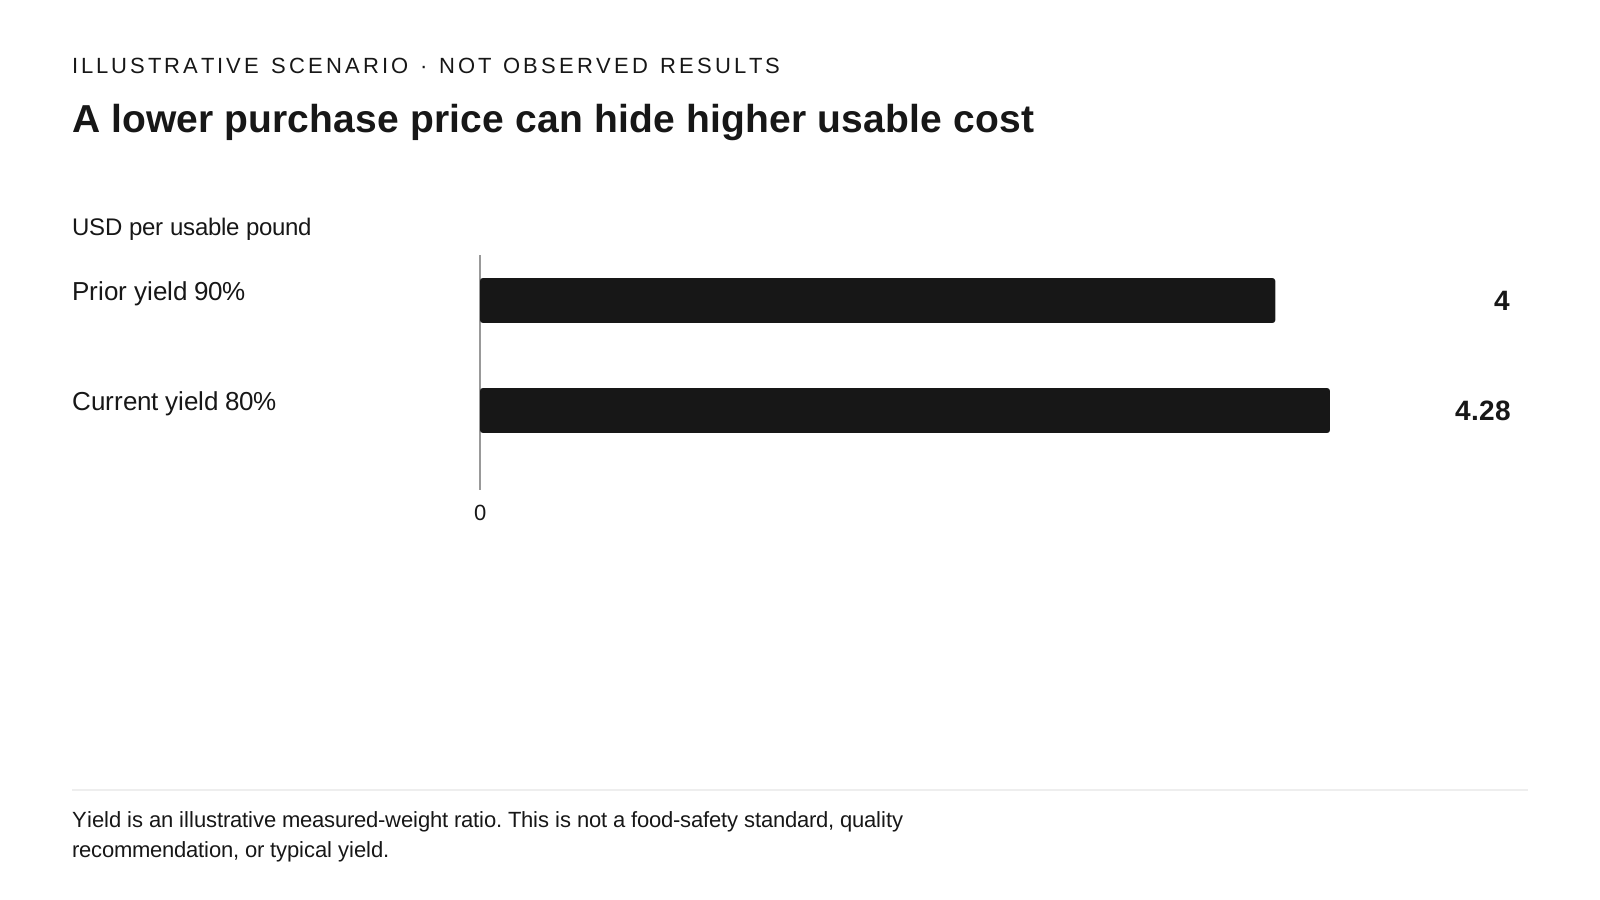
View chart data and method
hypothetical scenario · USD per usable pound
| Scenario / series | Value |
|---|---|
| Prior yield 90% | 4 |
| Current yield 80% | 4.275 |
3.60/0.90=4.00; 3.42/0.80=4.275.
Yield is an illustrative measured-weight ratio. This is not a food-safety standard, quality recommendation, or typical yield.
Source references: Original illustrative calculation; not observed results.
Producer price indexes describe prices received by producers, with specific treatment of transport and distribution. They do not reproduce every delivered restaurant invoice. [S1] The Employment Cost Index tracks compensation-cost changes using fixed weights; it does not equal the change in your weekly payroll. [S2] These are different measurement lenses, not two numbers to subtract and call margin relief.
Build a local sheet with one row per high-spend ingredient and labor department. Record the prior period's quantity or hours, prior unit cost, current comparable unit cost, source document, and effective date. Hold prior quantities fixed for the first pass. Sum prior quantity multiplied by the unit-cost change to estimate the rate effect. Then explain the remaining actual-spend change with quantity, yield, mix, and timing.
For example, a restaurant spending $3,000 on food and $3,200 on labor would save $120 if food rates fell 4%, while paying $160 more if labor rates rose 5%, holding the underlying quantities fixed. The combined $40 increase is about 0.65% of those two baseline costs. An unweighted average of -4% and +5% would obscure the actual dollars.
Compare equivalent food and equivalent work
Normalize pack size, delivered weight, grade, trim, freight, rebates, and credits before comparing invoices. Then measure usable output under the same recipe. A $3.60-per-pound ingredient at 90% usable yield costs $4 per usable pound. At $3.42 and 80% yield it costs $4.275. A cheaper purchase price has not lowered that recipe's usable-input cost.
Inventory timing matters. Bulk purchases may raise cash outflow this week without raising ingredients consumed this week. Use a consistent inventory roll-forward where available: opening inventory plus purchases less closing inventory, with documented transfers and adjustments. Do not compare a purchase total to a consumption-based food-cost target without reconciling them.
For labor, distinguish paid hours from effective hourly employer cost and fixed salary allocations. Define which benefits and employer charges the hourly figure includes; reconcile it to your own records rather than copying a national burden rate. Department mix, training hours, overtime premiums, and one-time payments can change payroll even when nobody's base wage changes.
Locate the dollars before changing prices or hours
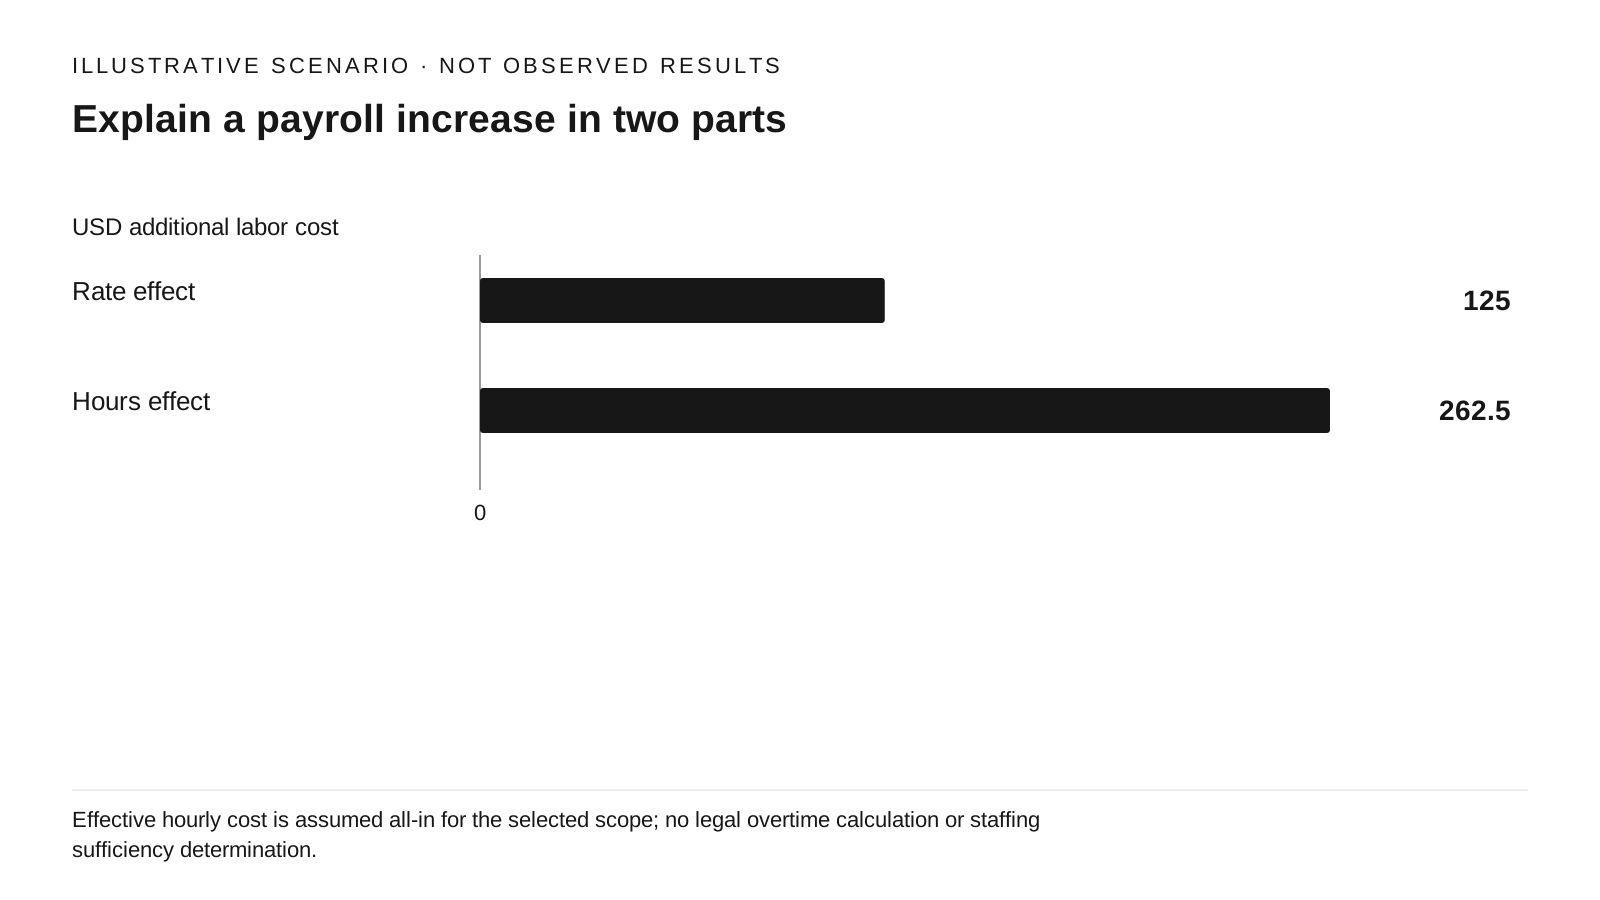
View chart data and method
hypothetical scenario · USD additional labor cost
| Scenario / series | Value |
|---|---|
| Rate effect | 125 |
| Hours effect | 262.5 |
100×(26.25-25)=125; (110-100)×26.25=262.5; total 387.5.
Effective hourly cost is assumed all-in for the selected scope; no legal overtime calculation or staffing sufficiency determination.
Source references: Original illustrative calculation; not observed results.
A second illustration starts with 100 hours at $25, or $2,500. If the effective hourly cost rises to $26.25 while hours increase to 110, total cost becomes $2,887.50. Using a rate-first bridge, the rate effect is 100 × $1.25 = $125; the extra-hours effect is 10 × $26.25 = $262.50. Together they explain the $387.50 increase. Other ordering conventions allocate the interaction differently, so label the method.
This distinction changes the next action. A rate change belongs in the labor planner's hourly-cost input. Extra hours require a review of service demand, prep, training, rework, and coverage. Yield loss belongs in recipe costing or the purchasing specification. None of these findings alone establishes that staffing should be cut or menu prices raised.
Prioritize by dollar exposure and controllability. A large percentage increase on a rarely purchased garnish may matter less than a small increase on the main protein. A higher-wage employee might reduce rework or increase throughput; a rate-only comparison would miss that. Review output and service outcomes alongside expense.
Refresh the assumptions that actually changed
At each weekly review, attach current invoices and payroll-period summaries to the cost bridge. Keep the previous values and the reason for each change. Mark unresolved differences such as missing credits, inconsistent pack sizes, or a purchase posted in the wrong week instead of smoothing them into an average.
Update the delivery calculator's food and incremental labor inputs only for the affected items or channels. Update the labor planner's hourly employer costs separately from planned hours. Run a base case and a plausible adverse case from your records; a national index can prompt the exercise but should not supply an unverified local price.
After the next comparable period, compare expected and actual dollar changes. If the bridge misses materially, investigate yields, portioning, mix, inventory, and payroll coding before attributing the gap to inflation. Keep any operational test small enough to reverse while measuring service quality and waste.
Sources & Verified On
Some editorial visuals may be AI-generated and are illustrative, not source evidence.
Verified: 2026-09-24T02:38:50Z · Research date and publication date are separate.
- Producer Price Indexes: Concepts
U.S. Bureau of Labor Statistics · United States · Last modified March 19, 2026
Published: Not stated · Reference period/event: Not applicable / not stated · Retrieved: 2026-09-24T02:38:50Z
No current commodity index value used. Producer prices are not a restaurant's delivered ingredient invoice.
- Employment Cost Index: Concepts
U.S. Bureau of Labor Statistics · United States · Last modified September 30, 2025
Published: Not stated · Reference period/event: Not applicable / not stated · Retrieved: 2026-09-24T02:38:50Z
No current wage or benefit rate used. Local payroll also changes with hours, roles, premiums, and fixed allocations.