What August 2026 restaurant sales tell an independent owner
The latest verified national sales release shows growth. Use the price context and scope limits before changing your local forecast.
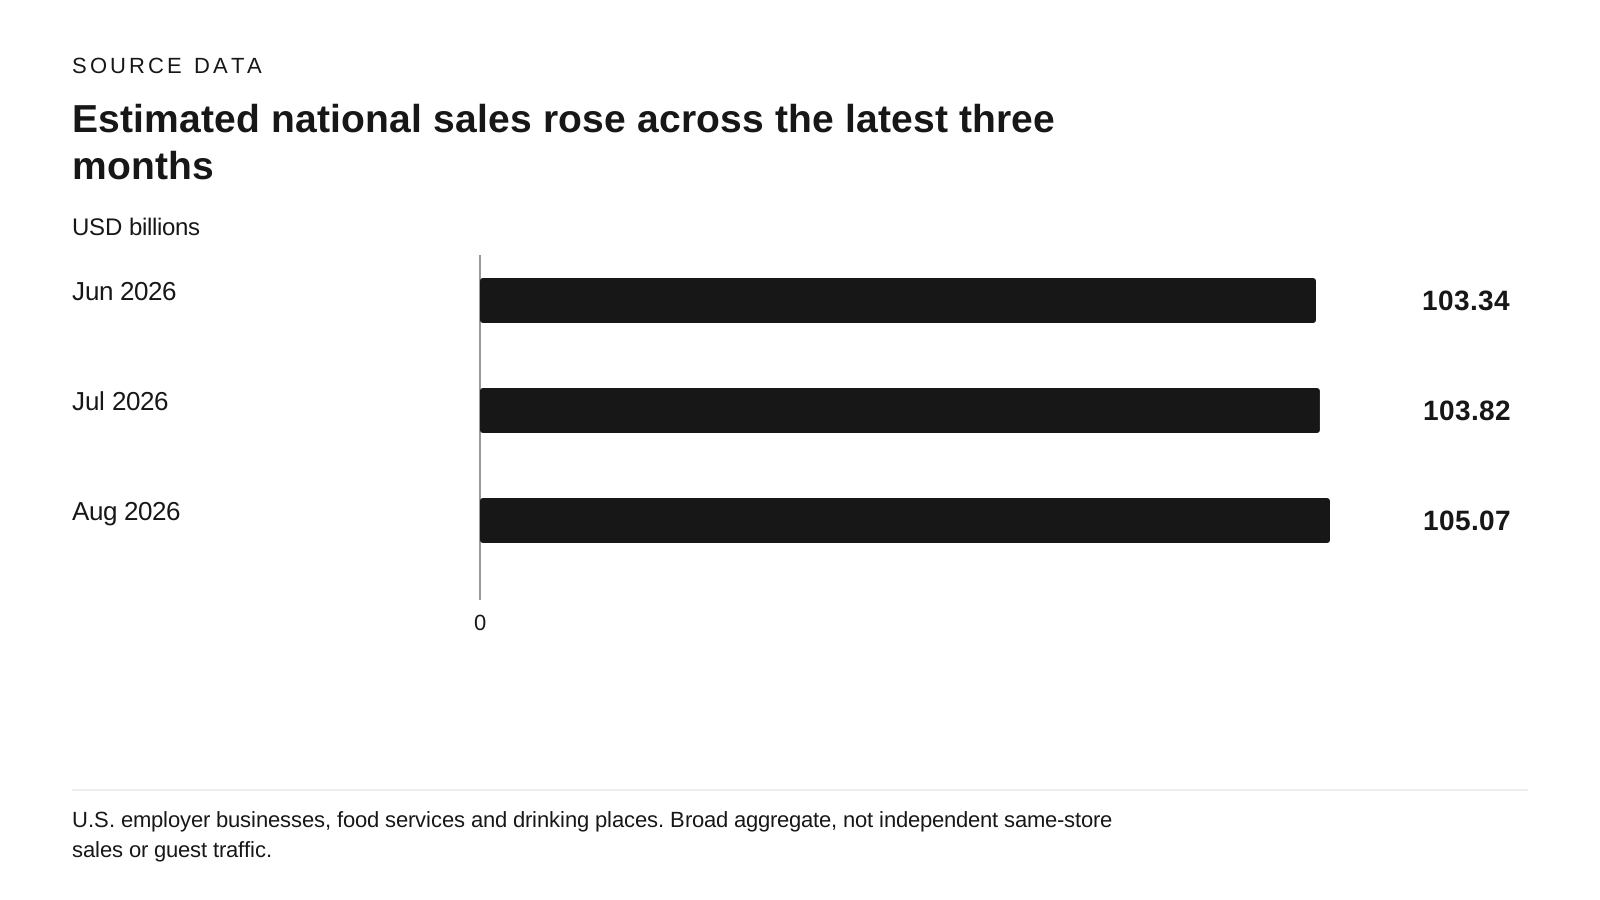
View chart data and method
source data · USD billions
| Scenario / series | Value |
|---|---|
| Jun 2026 | 103.34 |
| Jul 2026 | 103.824 |
| Aug 2026 | 105.07 |
Table 1 adjusted sales in USD millions divided by 1,000: 103340, 103824, 105070.
U.S. employer businesses, food services and drinking places. Broad aggregate, not independent same-store sales or guest traffic.
Source references: S1
Read the release date and the measurement together
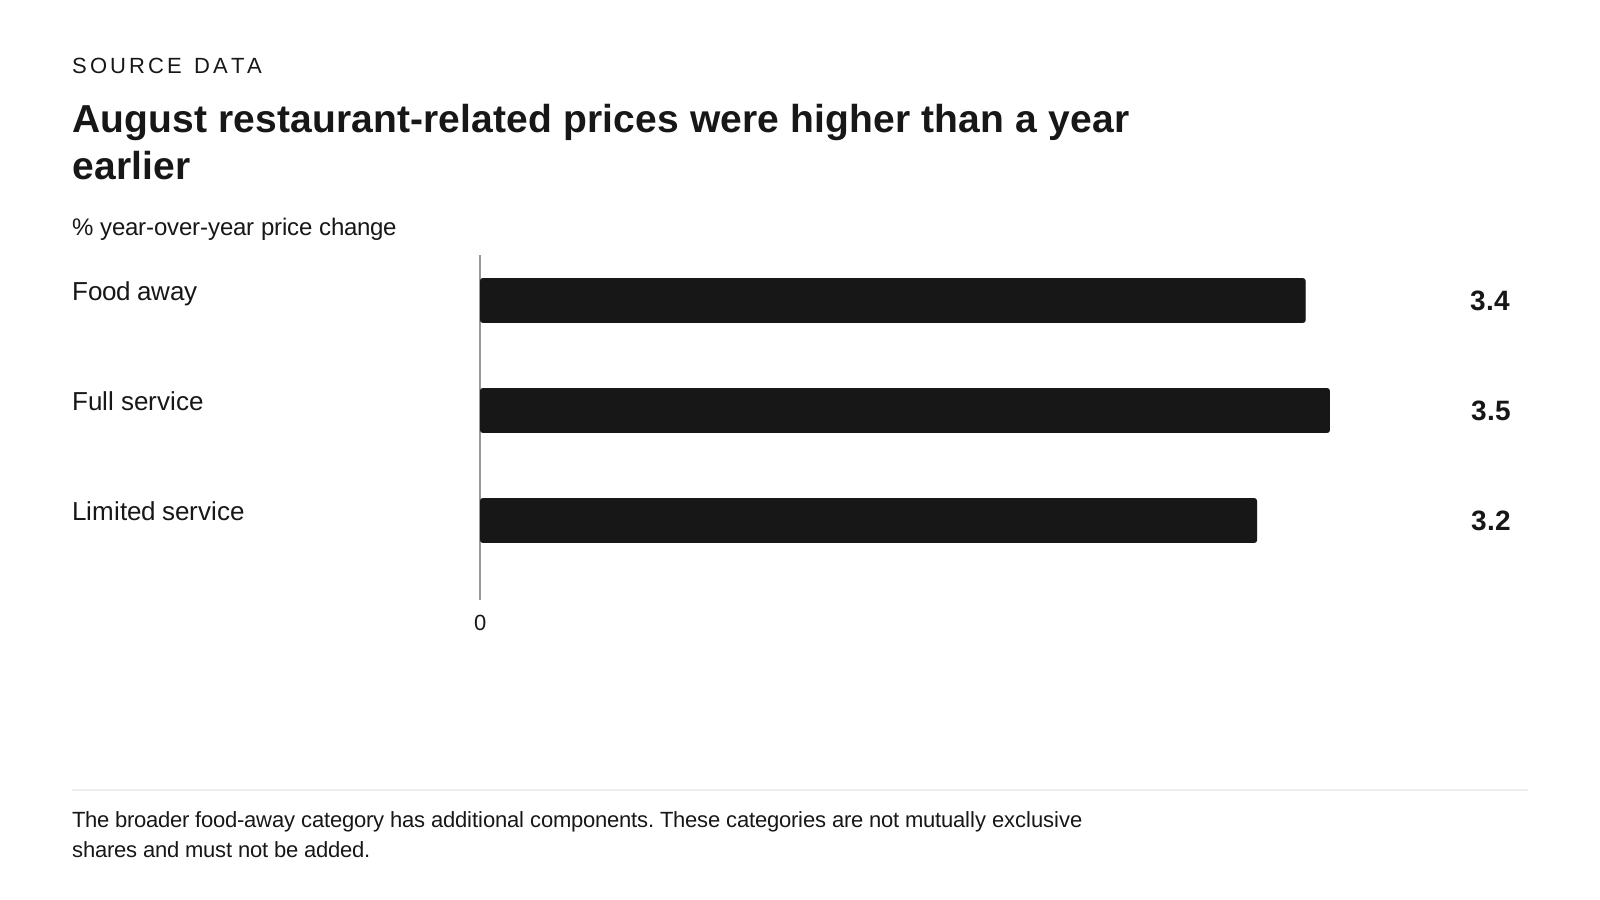
View chart data and method
source data · % year-over-year price change
| Scenario / series | Value |
|---|---|
| Food away | 3.4 |
| Full service | 3.5 |
| Limited service | 3.2 |
BLS CPI release, Food paragraph: food away from home 3.4%; full service 3.5%; limited service 3.2%.
The broader food-away category has additional components. These categories are not mutually exclusive shares and must not be added.
Source references: S2
As verified September 23, 2026 in Arizona, the latest accessible Census advance release covers August and was issued September 16. The food-services-and-drinking-places category rose 1.2% from July and 5.8% from August 2025 on a seasonally adjusted basis. These are sales dollars, unadjusted for inflation, for employer businesses. [S1] These are survey estimates subject to sampling and nonsampling error; a reported increase is not a certainty about every establishment.
The BLS August CPI release, issued September 11, reports food-away-from-home prices up 3.4% over twelve months. Full-service-meal prices rose 3.5%; limited-service-meal prices rose 3.2%. These are national consumer-price measures, not your menu's realized average check. [S2]
Taken together, the releases support a narrow statement: national nominal food-service sales increased while restaurant-related consumer prices were also higher than a year earlier. They do not directly report whether an independent restaurant served more people, sold larger orders, or gained margin. Those distinctions are the owner's next measurement task, not a hidden conclusion inside the national headline.
Keep the independent-restaurant inference narrow
A national aggregate blends different business formats, locations, store openings and closures, and purchasing occasions. An operator with one neighborhood dining room has a different exposure from the entire category. A favorable national figure is a reason to inspect your local performance, not a target every existing restaurant should have reached.
Nor does subtracting the CPI change from sales growth give an observed traffic estimate. The surveys have different universes and weights, and a restaurant check combines price, number of items, modifiers, discounts, and mix. Even a carefully aligned inflation adjustment estimates a sales-volume concept rather than counted guest visits.
Competing explanations remain plausible: larger orders, a change in channel mix, more operating establishments, different consumer occasions, or more actual orders. The releases reviewed here do not separate those explanations for independent restaurants. Do not use one of them as the stated reason for a local staffing or pricing decision without a local record.
Stress-test the local order assumption
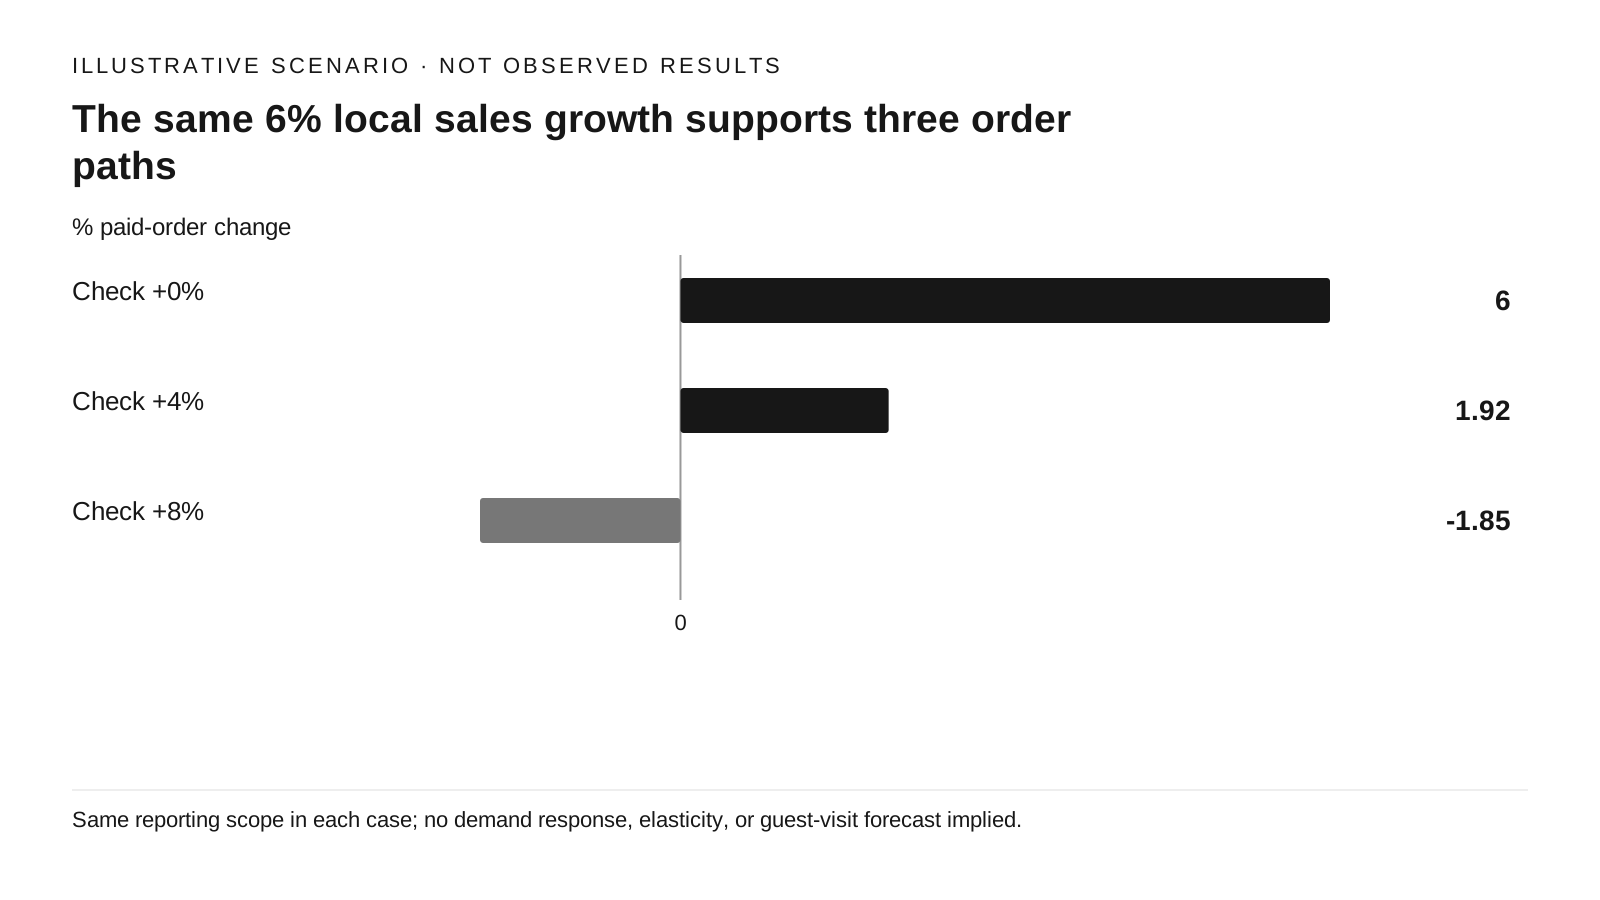
View chart data and method
hypothetical scenario · % paid-order change
| Scenario / series | Value |
|---|---|
| Check +0% | 6 |
| Check +4% | 1.9231 |
| Check +8% | -1.8519 |
100×(1.06/(1+c)-1), for c=0, 0.04, 0.08.
Same reporting scope in each case; no demand response, elasticity, or guest-visit forecast implied.
Source references: Original illustrative calculation; not observed results.
To see the decision risk, consider a hypothetical restaurant whose sales rise 6%. If average check is unchanged, paid orders must rise 6%. If average check rises 4%, orders rise only 1.92%; if check rises 8%, orders fall 1.85%. The calculation is order growth = 1.06 divided by one plus check growth, minus one. These are deliberately chosen local scenarios, not estimates derived from the national releases.
The three cases imply different prep and staffing questions even though the revenue increase is identical. Use observed order counts and service times to choose a plan, then test whether the resulting labor budget can support it. Higher checks can improve a budget without reducing workload; lower order counts can still hide more complicated baskets.
A practical response to this release is therefore conditional. If comparable local orders and contribution both improve, examine whether an existing bottleneck limits profitable demand. If revenue rises while orders or contribution weaken, investigate the mix and costs first. If local results are noisy, maintain a reversible schedule and collect another comparable period.
Set a refresh trigger before relying on the snapshot
Save this release period beside your own matched-period report. Compare sales, paid orders, average check, open hours, and contribution by channel. Annotate closures, weather, local events, availability, and promotions. An unadjusted local week is not directly comparable to a seasonally adjusted national month.
Census announced a historical revision tentatively scheduled for September 28 and the next monthly release for October 15. [S1] Recheck the historical figures at that revision and before publication or a material forecast decision. A revised number should be recorded as a new observation rather than silently replacing the original reading.
Use the labor budget planner for low, central, and high local sales cases with current hourly costs. Keep staffing sufficiency and service coverage as separate operational judgments. This article has no independent-store panel or local transaction data, so it does not supply a reliable three-month demand forecast.
Sources & Verified On
Verified: 2026-09-24T02:38:50Z · Research date and publication date are separate.
- Advance Monthly Sales for Retail and Food Services, August 2026
U.S. Census Bureau · United States
Published: 2026-09-16 · Reference period/event: 2026-08 · Retrieved: 2026-09-24T02:38:50Z
Advance and preliminary figures subject to revision. Seasonal adjustment is not inflation adjustment. Category not restricted to independent restaurants; no guest counts. Rolling current URL will change.
- Consumer Price Index — August 2026
U.S. Bureau of Labor Statistics · United States
Published: 2026-09-11 · Reference period/event: 2026-08 · Retrieved: 2026-09-24T02:38:50Z
Consumer price measures, not restaurant revenue or order counts. Dated September 11, 2026 archive preserves this research vintage.