Sales are up. Are more guests actually ordering?
Read sales, paid orders, and average check together before treating revenue growth as stronger demand.

View chart data and method
Illustrative example, not observed restaurant performance: sales $20,000 to $20,800; orders 1,000 to 950.
hypothetical scenario · % change
| Scenario / series | Value |
|---|---|
| Sales | 4 |
| Paid orders | -5 |
| Average check | 9.4737 |
Sales change = 20800/20000-1; order change = 950/1000-1; check change = (20800/950)/(20000/1000)-1; multiply each by 100.
Identical net-sales definitions and comparable periods; calculations do not estimate demand elasticity.
Source references: Original illustrative calculation; not observed results.
Start with a matched three-number report
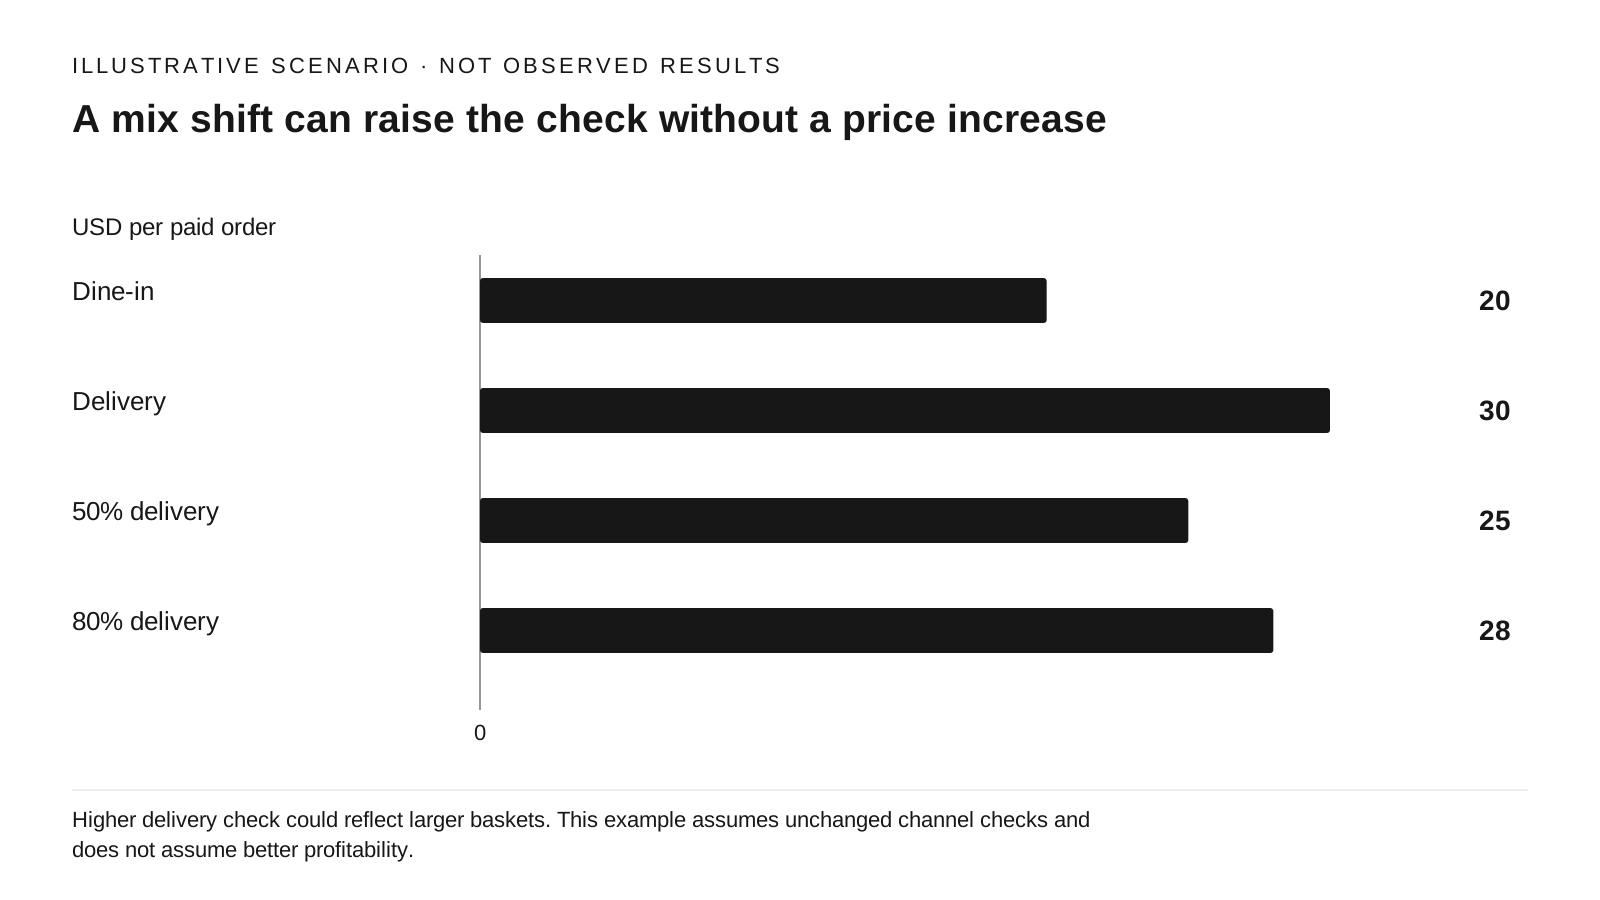
View chart data and method
hypothetical scenario · USD per paid order
| Scenario / series | Value |
|---|---|
| Dine-in | 20 |
| Delivery | 30 |
| 50% delivery | 25 |
| 80% delivery | 28 |
Blended check = dine-in share × 20 + delivery share × 30; 0.5×20+0.5×30=25; 0.2×20+0.8×30=28.
Higher delivery check could reflect larger baskets. This example assumes unchanged channel checks and does not assume better profitability.
Source references: Original illustrative calculation; not observed results.
The Census Bureau's advance retail survey collects dollar sales, reporting period, and establishment counts. Its sales series is useful context, but it is not your restaurant's count of orders or guests. [S1] Begin locally with net food-and-beverage sales, completed paid orders, and average sales per paid order from the same report scope.
For this guide, exclude sales tax, tips, voids, and fully canceled orders. Apply discounts and refunds consistently to the revenue and order period, document any refund for an earlier period, and decide how catering, gift-card redemption, and delivery are treated. If a ticket is split into multiple payments, count the ticket once. A party of four and a solo takeout buyer may each produce one order; order counts must not be relabeled guest traffic.
Our illustration starts with $20,000 and 1,000 paid orders, or a $20 average check. The next comparable period has $20,800 and 950 orders, or $21.89. Revenue rose 4%, orders fell 5%, and average check rose about 9.47%. Those three facts can coexist. The identity describes the arithmetic; it cannot say whether a price change caused fewer orders.
Separate price, basket size, and mix
A check increase is a question to investigate. First compare identical items at identical modifiers and discount treatment. Then compare items per order. Finally split by channel, daypart, and order type. More group delivery tickets or fewer low-priced beverage-only tickets can lift the blended average even when no menu price changed.
The CPI measures consumer price change across a basket. Its categories and coverage are different from a restaurant's own product mix. [S2] Dividing your sales by a broad price index can be a rough sensitivity check; it does not reconstruct your order count, visits, or customers. A restaurant that changed portions, hours, promotions, and mix needs its own item-level bridge.
Match the comparison before judging the result: same stores, similar opening days and hours, comparable weekdays, and annotated holidays or special events. Compare weekly totals and per-open-hour figures together. A shop that shortened hours may improve sales per hour while losing total contribution. Do not hide the missing hours inside an efficiency claim.
Check what the extra revenue leaves behind
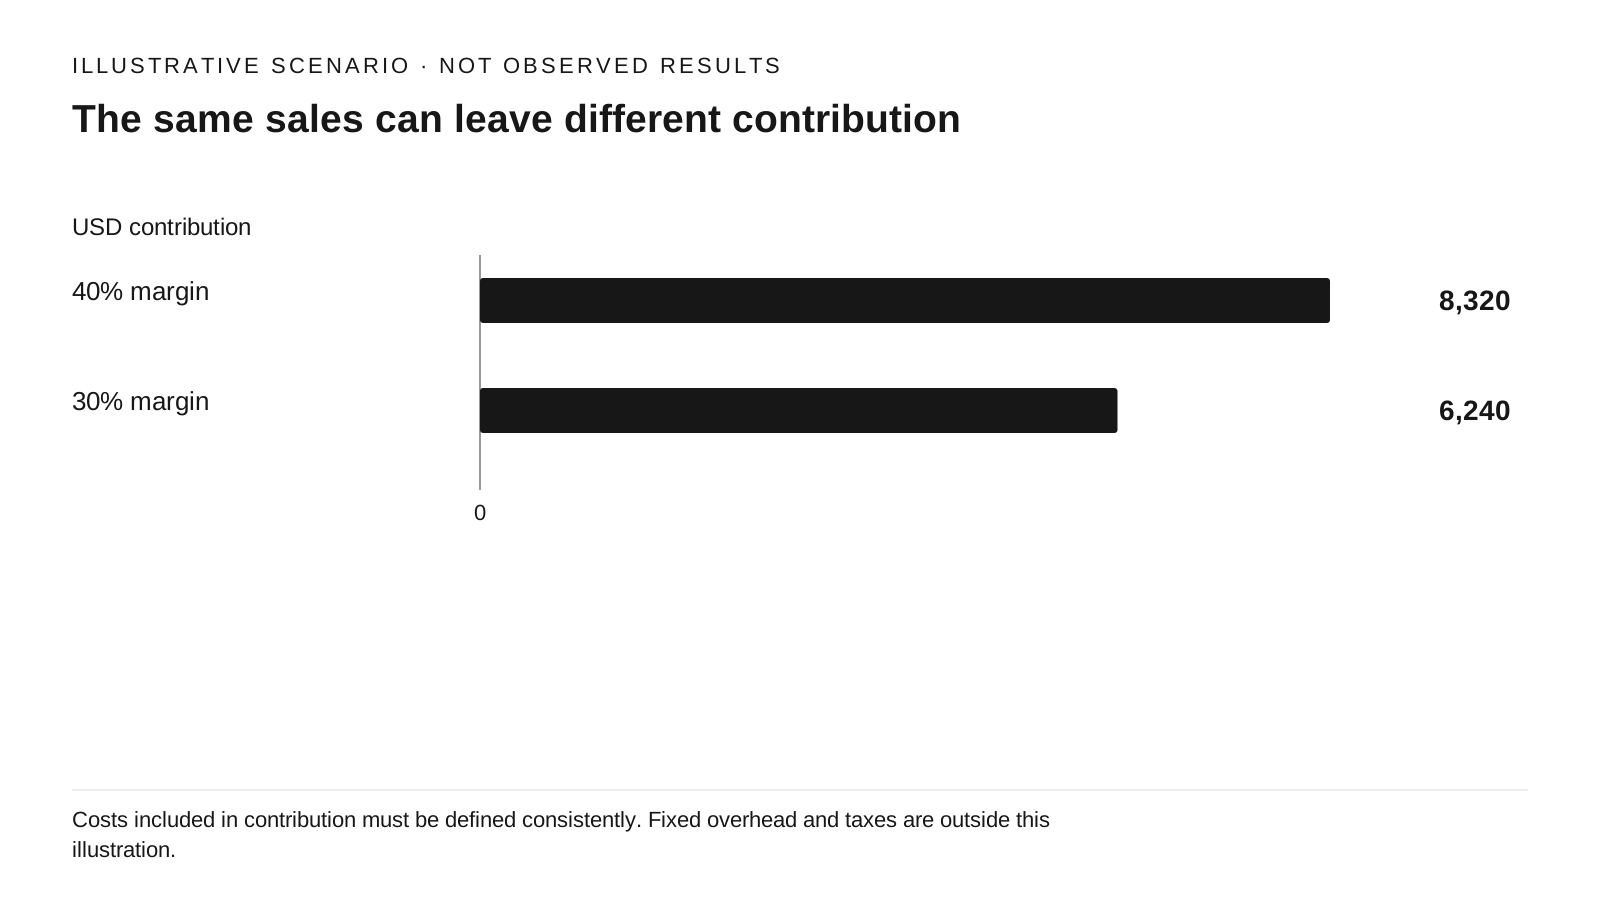
View chart data and method
hypothetical scenario · USD contribution
| Scenario / series | Value |
|---|---|
| 40% margin | 8320 |
| 30% margin | 6240 |
20800×0.40=8320; 20800×0.30=6240.
Costs included in contribution must be defined consistently. Fixed overhead and taxes are outside this illustration.
Source references: Original illustrative calculation; not observed results.
The sales bridge tells you where to investigate; the contribution bridge determines whether the change helps pay fixed costs. Use a consistent definition of contribution: sales less the explicitly included variable costs, such as food, packaging, payment or platform fees, and incremental paid labor. This is not net profit.
In a separate illustration, $20,800 of sales at a 40% contribution margin leaves $8,320; at 30% it leaves $6,240. Both have the same top line. A shift toward higher-fee orders could produce that result, but so could a different food mix or additional labor. Treat the explanation as a hypothesis until the cost records support it.
If paid orders fall while contribution holds, investigate which orders disappeared before starting a blanket discount. If contribution falls while paid orders rise, investigate mix, discount funding, and workload before adding permanent capacity. Either decision can be wrong if an unusual event or incomplete reporting created the apparent change.
Use a weekly exception review
Create one row per comparable week with open days, open hours, net sales, paid orders, average check, and contribution under your chosen cost scope. Add channel and daypart detail only when it explains a material change. Reconcile the first report to the underlying ticket totals before using it to adjust the schedule.
Choose investigation triggers before reading the next report: for example, a sustained order decline across matched service periods or falling contribution despite higher sales. These are owner-selected thresholds, not validated industry cutoffs. Review weather, outages, menu availability, event bookings, and promotions beside each flagged week.
Assign one follow-up to each exception: inspect item prices for a check change, inspect availability for an order decline, or inspect channel fees for a contribution decline. Use the delivery contribution calculator for the channel comparison and the labor planner for a revised sales scenario. Recheck after another comparable period; a single week does not establish a lasting trend.
Sources & Verified On
Some editorial visuals may be AI-generated and are illustrative, not source evidence.
Verified: 2026-09-24T02:34:42Z · Research date and publication date are separate.
- About the Advance Monthly Retail Trade Survey
U.S. Census Bureau · United States
Published: Not stated · Reference period/event: Not applicable / not stated · Retrieved: 2026-09-24T02:34:42Z
Methodology page includes historical descriptions; no current sales estimate is taken from this page. Survey totals are not local orders, customer counts, or independent-restaurant-only results.
- Consumer Price Index: Concepts
U.S. Bureau of Labor Statistics · United States · Page last modified April 10, 2025
Published: Not stated · Reference period/event: Not applicable / not stated · Retrieved: 2026-09-24T02:34:42Z
No current inflation number is cited. CPI does not measure this restaurant's orders or exact menu mix.