Turn online food buzz into a testable menu question
Searches and social attention can identify an idea. A local offer at a stated price is needed to learn whether your guests will buy it.

View chart data and method
Illustrative denominators; neither test has been run.
hypothetical scenario · % eligible orders selecting item
| Scenario / series | Value |
|---|---|
| 30 of 200 | 15 |
| 30 of 600 | 5 |
30/200×100=15; 30/600×100=5.
An eligible order opportunity is defined before testing; this metric does not count people, views, or repeat demand.
Source references: Original illustrative calculation; not observed results.
Identify exactly what the online signal measures
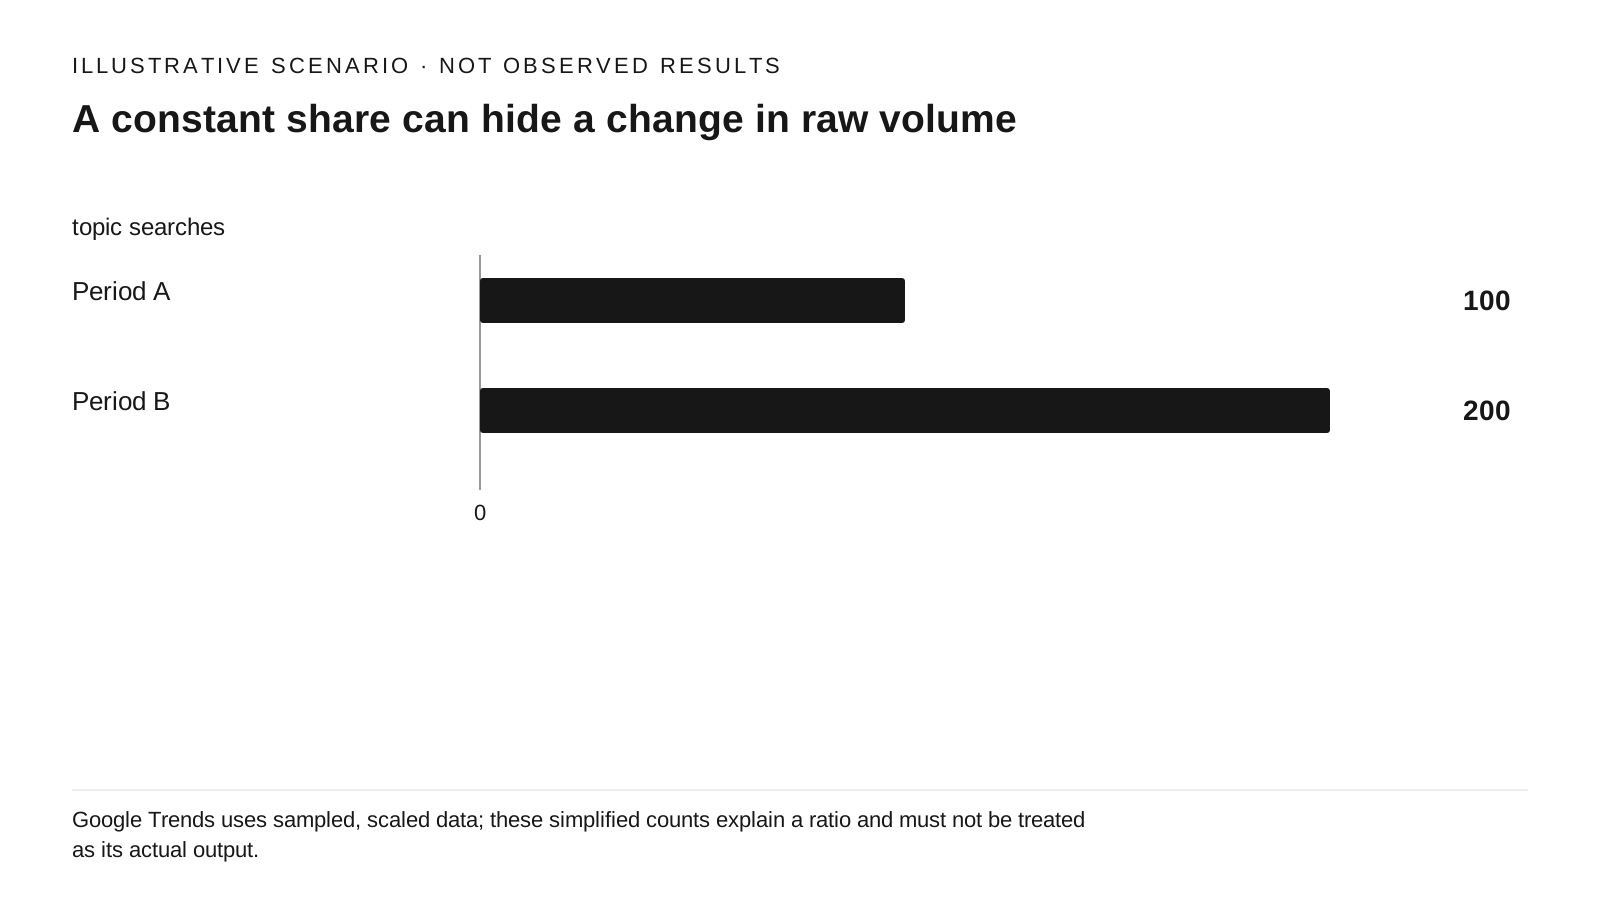
View chart data and method
hypothetical scenario · topic searches
| Scenario / series | Value |
|---|---|
| Period A | 100 |
| Period B | 200 |
Period A 100/10000=1%; Period B 200/20000=1%. Bars show numerator counts, caption supplies denominators.
Google Trends uses sampled, scaled data; these simplified counts explain a ratio and must not be treated as its actual output.
Source references: Original illustrative calculation; not observed results.
Google describes Trends as sampled, normalized search-interest data. Values are scaled relative to the selected time and geography, and low-volume terms may show zero. Google also says the data are not a scientific poll. [S1] A spike can justify investigating a dish, but it does not establish paid demand at your restaurant or at your intended price.
A social post adds different questions: whose audience saw it, whether distribution was paid, whether views were repeat views, and whether the post was about making the food at home or buying it nearby. If the platform does not disclose those details, record them as unknown. Do not multiply views by an invented conversion rate and call the result a sales forecast.
Even raw search counts would need a denominator. In a hypothetical period, 100 searches among 10,000 total searches and 200 among 20,000 both represent a 1% share. This arithmetic explains why relative interest and absolute volume differ; it is not an exported Google Trends series or a reconstruction of its sampling process.
Translate the idea into an offer your guests can judge
Write a narrow proposition: a specific flavor, portion, format, and price, offered in a defined channel and daypart. For a lunch counter, a familiar bowl with a new topping may test the flavor more cleanly than a wholly new dish with a new portion size and price. For a destination restaurant, the presentation itself may be part of the offer; stripping it away would test a different proposition.
Check practical fit before buying a full case: can existing ingredients support a small batch, is the station available, can the item travel as sold, and can staff describe the offer accurately? Define recipe and service requirements through your existing operating procedures. Online popularity supplies no assurance about allergens, handling, or suitability for your kitchen.
Treat stated interest as a separate stage. Staff requests, guest comments, a nonbinding poll, and paid purchases answer different questions. Keep their denominators separate. Do not describe an item as unavailable merely to measure interest, or imply popularity or scarcity that has not been observed.
Use a paid test that can fail cheaply
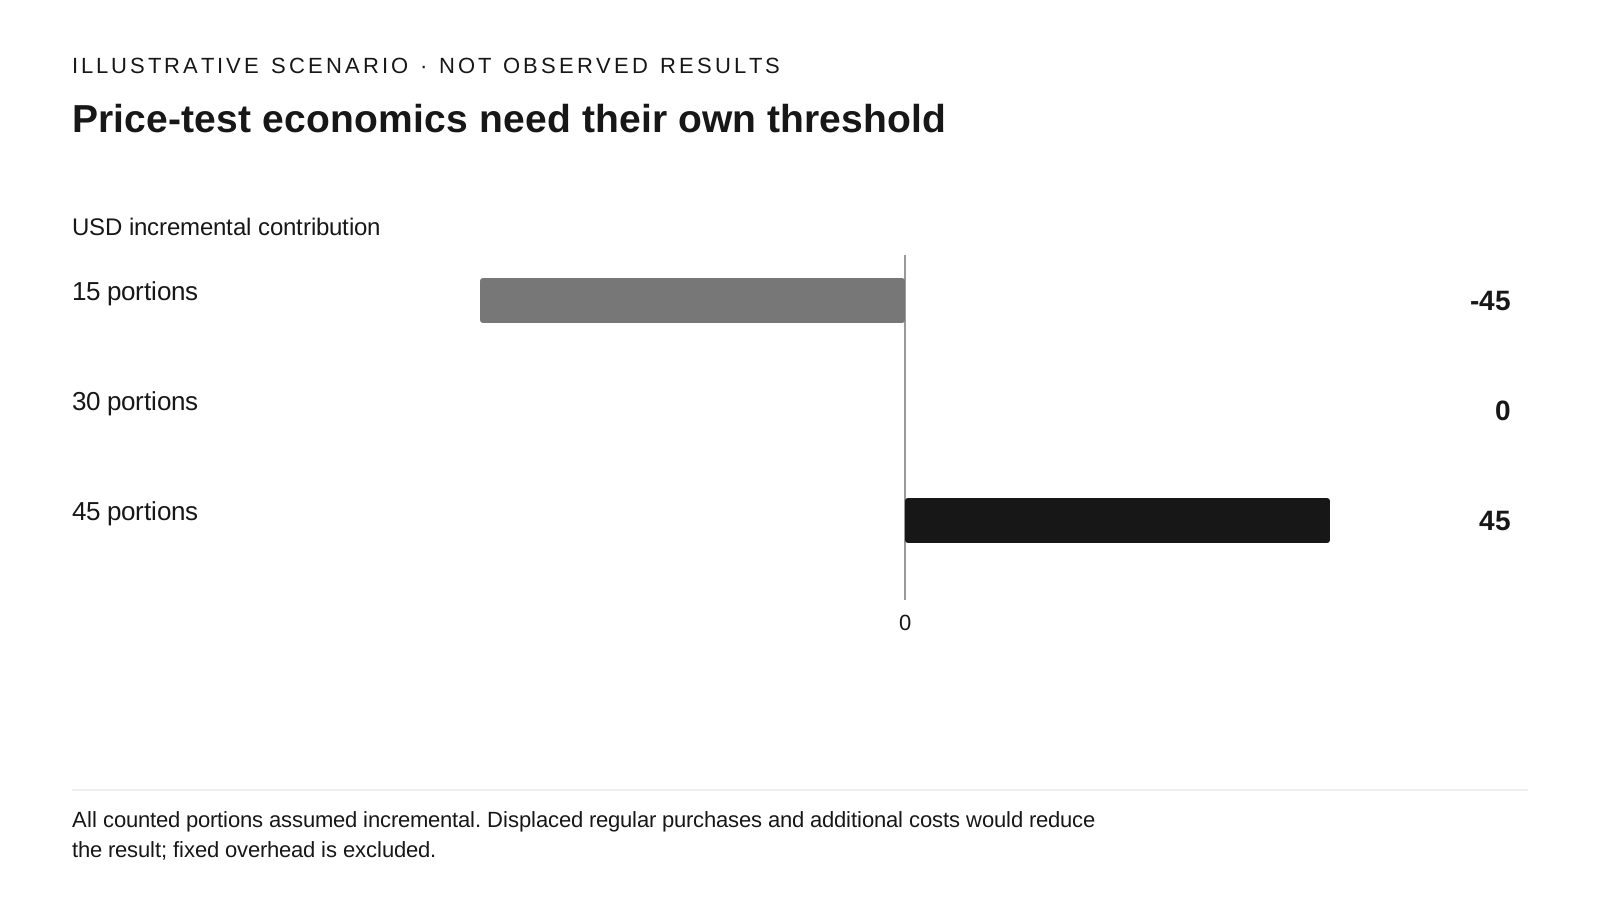
View chart data and method
hypothetical scenario · USD incremental contribution
| Scenario / series | Value |
|---|---|
| 15 portions | -45 |
| 30 portions | 0 |
| 45 portions | 45 |
3×Q-90 for Q=15,30,45.
All counted portions assumed incremental. Displaced regular purchases and additional costs would reduce the result; fixed overhead is excluded.
Source references: Original illustrative calculation; not observed results.
Choose a bounded test budget and a set of comparable service periods. Record eligible orders while the item was actually available and offered, orders selecting it, selling price, discounts, and stockouts. If you cannot observe menu exposure, call the denominator eligible orders rather than exposed guests. In the illustration above, 30 eligible orders selecting the item out of 200 gives a 15% selection rate; 30 out of 600 gives 5%. Neither proves the offer brought in new guests.
Set the economics independently of the attention metric. Suppose the test costs $90 in setup and nonrecoverable materials, and each paid portion leaves $3 after the variable costs you include. It needs 30 genuinely incremental portions to cover that amount. Fifteen leave a $45 shortfall; 45 leave $45. If a trial purchase replaces a normal item, deduct that displaced contribution before counting the test as incremental.
A test can be informative even when the first result is weak. Poor selection with a clear offer may indicate a poor fit, but an obscure menu position, an unrepresentative event crowd, early sellout, or inadequate explanation can also distort the result. Change one material element at a time and identify the new version; do not blend every iteration into a success rate.
Decide what evidence earns a larger test
Before opening sales, write the decision rule in ordinary language: continue only if paid selection and contribution meet owner-chosen thresholds without unacceptable service disruption or waste. Record who will review the result and when. The thresholds depend on your cost and capacity; this guide offers no universal winning selection rate.
At review, distinguish three outcomes. A viable paid test can earn a longer repeat-purchase trial. Clear economic or operational failure can end the experiment. Missing exposure records, heavy stockouts, or too few comparable periods call for an inconclusive result, with the specific missing evidence named.
Retain a one-page record of the original attention source, geography, query or post date, offer version, actual test cost, and local outcomes. MT-03 explains the next step: evaluating a limited-time item through sales, repeat opportunity, and waste. Do not promote the dish to the permanent menu solely because the original post is still spreading.
Sources & Verified On
Some editorial visuals may be AI-generated and are illustrative, not source evidence.
Verified: 2026-09-24T02:42:57Z · Research date and publication date are separate.
- FAQ about Google Trends data
Google · Global; query geography must be selected · Documentation accessed during research
Published: Not stated · Reference period/event: Not applicable / not stated · Retrieved: 2026-09-24T02:42:57Z
Company documentation describes its own measurement product. No live food query series or local demand observation was collected.