New dish or add-on? Compare what each changes
Compare incremental contribution, displaced sales, shared ingredients, and scarce station time before expanding the menu.
View chart data and method
New dish: 60 sold, 40 displace regular dishes. Add-on: 100 additional purchases, no displacement. These volumes are assumptions.
hypothetical scenario · USD incremental test contribution
| Scenario / series | Value |
|---|---|
| New dish | 110 |
| Add-on | 190 |
New dish 60×8.50-40×7-120=110; add-on 100×2.30-40=190.
Same test period. Results depend on sales and displacement assumptions and do not predict demand; fixed business overhead excluded.
Source references: Original illustrative calculation; not observed results.
Define the unit and the cost scope
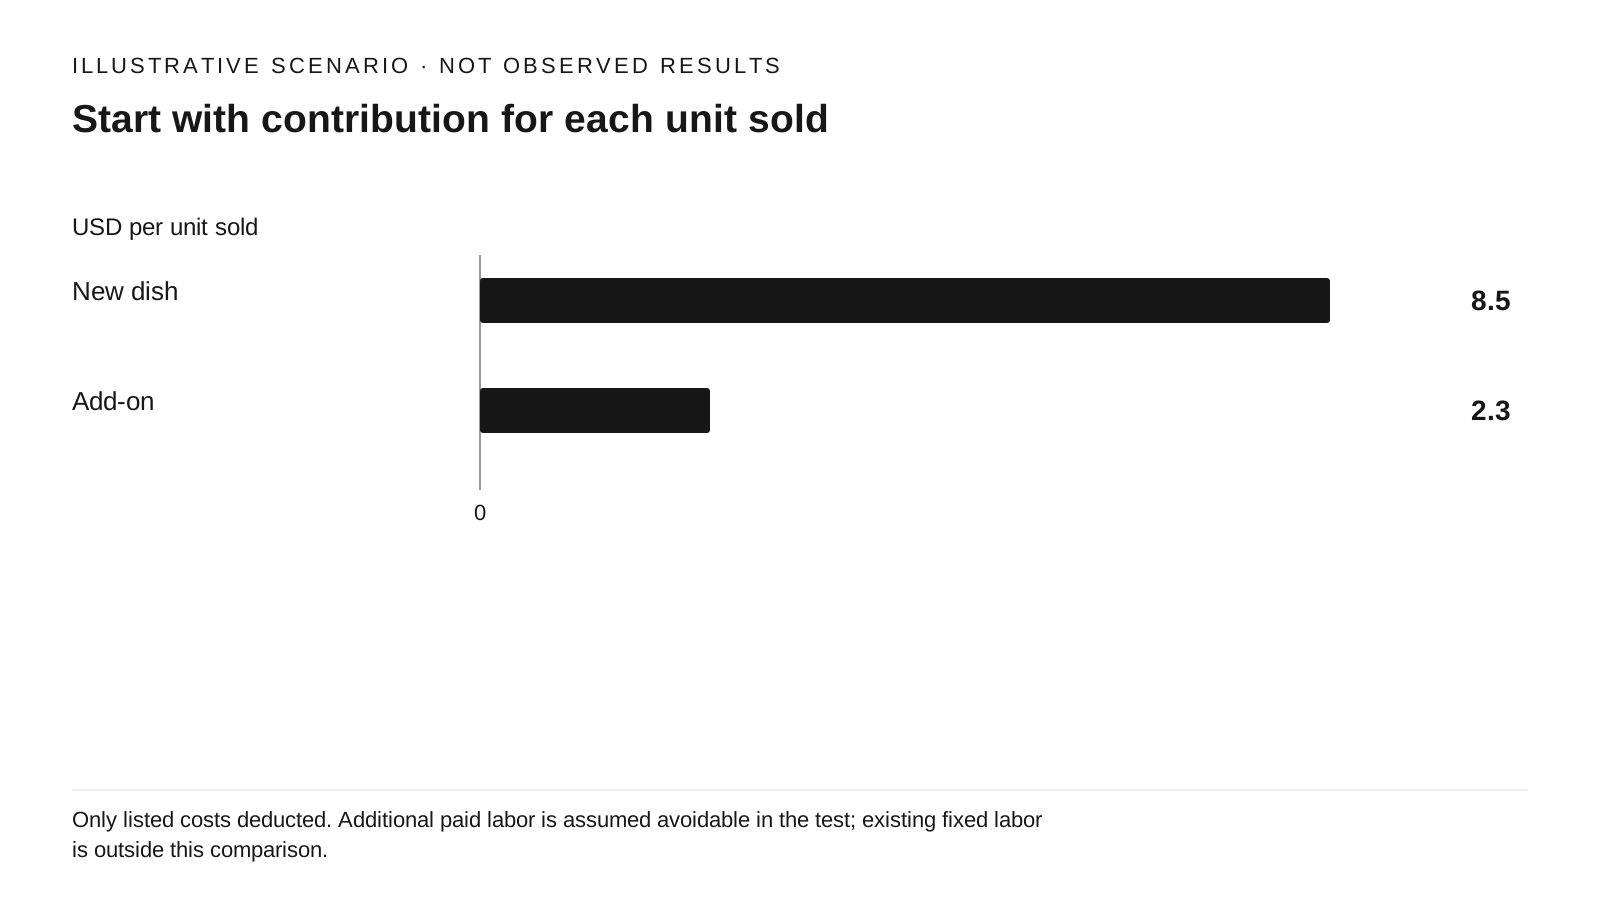
View chart data and method
hypothetical scenario · USD per unit sold
| Scenario / series | Value |
|---|---|
| New dish | 8.5 |
| Add-on | 2.3 |
Dish 16-5.50-0.50-1-0.50=8.50; add-on 4-1.10-0-0.40-0.20=2.30.
Only listed costs deducted. Additional paid labor is assumed avoidable in the test; existing fixed labor is outside this comparison.
Source references: Original illustrative calculation; not observed results.
The BC Cook Articulation Committee's menu-engineering chapter separates dollar contribution from food-cost percentage. Its basic contribution definition subtracts standard food cost from selling price. [S1] For this decision we use a broader, explicitly labeled measure: selling price less food, packaging, transaction costs, and additional paid labor attributable to the offer. Neither definition is net profit.
Our illustrative new dish sells for $16. Food costs $5.50, packaging $0.50, additional paid labor $1, and incremental transaction fees $0.50, leaving $8.50 per dish. An add-on sells for $4 with $1.10 food, no additional packaging, $0.40 additional paid labor, and $0.20 fees, leaving $2.30. All figures are chosen examples; obtain the actual recipe and contract costs before using this model.
Compare an add-on's incremental price and cost with the base item unchanged. If adding the option changes the base dish's portion, packaging, prep, or fees, include that change. Do not assign an entire order's payment fee twice, and do not count a labor cost both in the unit and again in setup.
Map what the recipe adds to the kitchen
List each new ingredient, its purchase unit, usable yield, minimum order, storage location, and other current menu uses. The yield-testing chapter explains why purchased weight and usable product differ. [S2] Price the usable portion and include expected unavoidable waste. Shared ingredients reduce a new purchasing commitment only when existing demand can actually use the remaining stock.
Then walk through receiving, prep, service, and cleanup. A new dish may introduce a dedicated sauce batch, an additional pan, a separate assembly sequence, or another package. An add-on may use existing stock yet still require a difficult modifier handoff at the busiest station. Count those changes rather than assigning a vague complexity score.
Record which work happens before service and which occupies the constraint during a rush. Observe the proposed method under a small controlled rehearsal and retain the measured range. A supplier's promise that a product is convenient is not a timed result in your layout. Resolve training and recipe-control needs before offering the item.
Subtract replacement sales and test the constraint
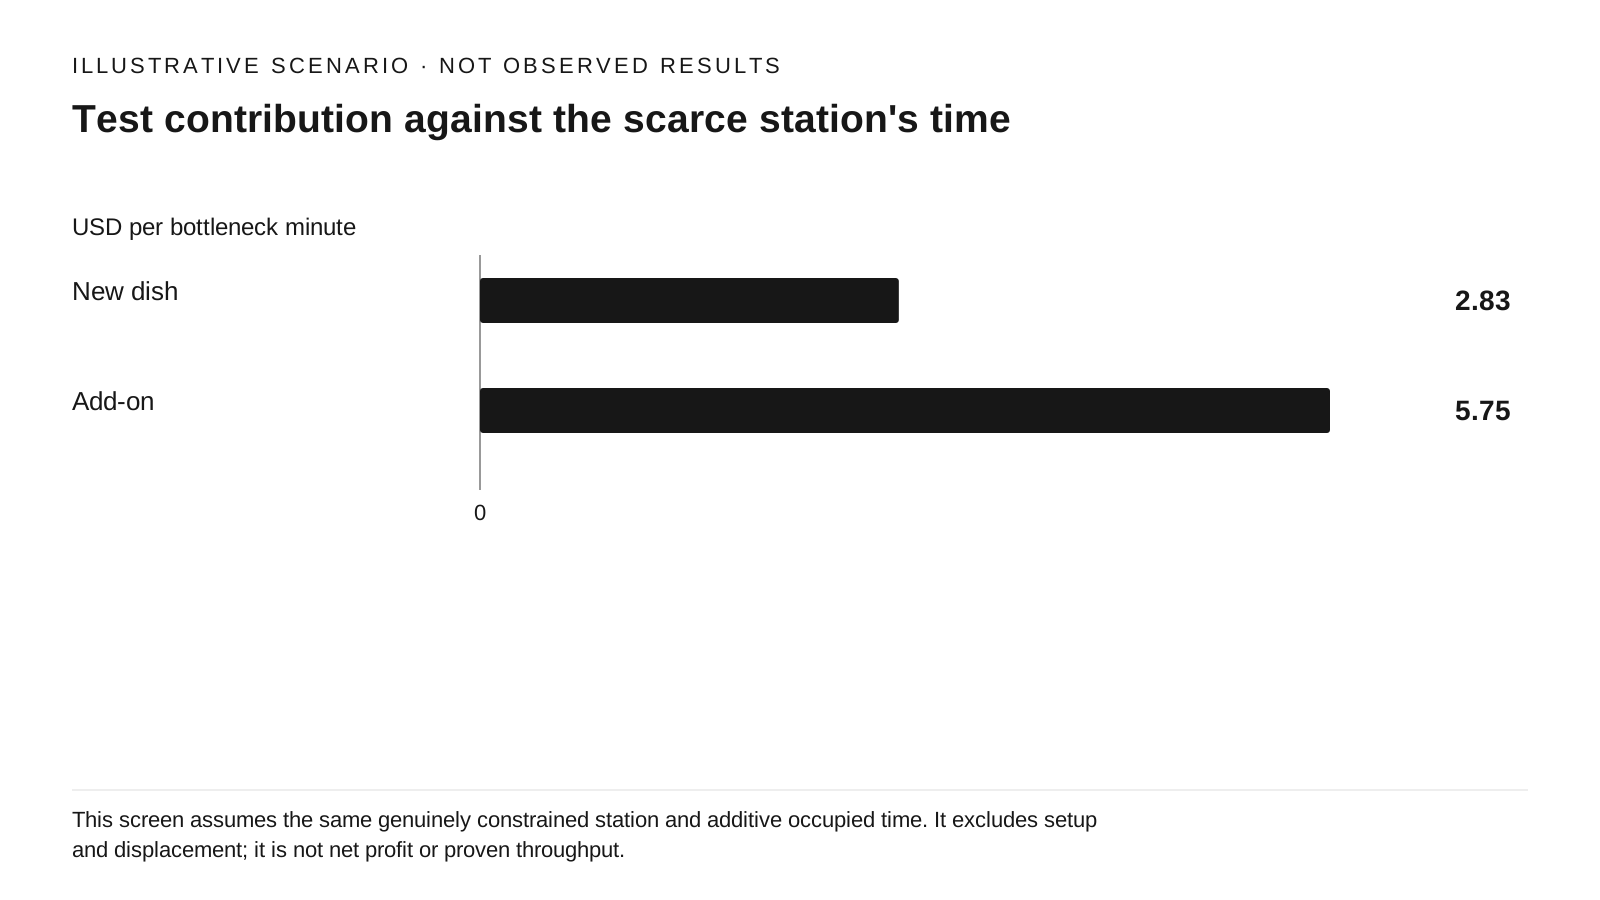
View chart data and method
hypothetical scenario · USD per bottleneck minute
| Scenario / series | Value |
|---|---|
| New dish | 2.8333 |
| Add-on | 5.75 |
8.50/3=2.833333; 2.30/0.4=5.75.
This screen assumes the same genuinely constrained station and additive occupied time. It excludes setup and displacement; it is not net profit or proven throughput.
Source references: Original illustrative calculation; not observed results.
In the weekly illustration, 60 new dishes at $8.50 produce $510 before setup and displacement. If 40 replace regular dishes that would have contributed $7 each, subtract $280. After $120 of test setup, the incremental amount is $110. One hundred add-ons at $2.30, with no displaced purchase and $40 setup, leave $190. The add-on wins only under those assumptions.
The choice reverses if the new dish replaces fewer regular purchases: with zero displacement it leaves $390 after setup. Holding the other assumptions fixed, it falls below the add-on's $190 when more than 28.57 regular dishes are displaced, or 29 whole dishes. You cannot observe that counterfactual merely by tagging new-item sales; matched service periods and regular-item mix provide evidence, with uncertainty retained.
If a station is truly constrained, compare contribution with its occupied time as another screen. At three incremental bottleneck minutes per new dish, $8.50 is about $2.83 per minute; at 0.4 minute per add-on, $2.30 is $5.75 per minute. These are hypothetical times. This ratio is not a scheduling optimizer: batch work, parallel tasks, guest preferences, and lost regular orders can change the result.
Choose a bounded comparison, not a permanent commitment
Prepare a one-page comparison with recipe versions, input sources, planned test periods, expected demand ranges, plausible displacement, setup spending, and peak station time. Specify what would make either option unacceptable: an unmanageable ingredient commitment, service delays, or contribution below your own threshold. Do not use the illustrative numbers here as defaults for your restaurant.
Test the version that fits a reversible batch and a clear learning question. If both are plausible, use comparable dayparts and consistent offer visibility and price treatment. Keep ingredient availability, special events, and staff changes in the record. Review ordinary-menu contribution alongside test-item sales so that substitution is visible.
Advance only when paid selection, repeat opportunity, waste, and service evidence support the economics. An add-on may be the better small test of a flavor; a new dish may better express the concept or attract a different occasion. The decision depends on the observed operation and guest response, which this calculation cannot supply.
Sources & Verified On
Some editorial visuals may be AI-generated and are illustrative, not source evidence.
Verified: 2026-09-24T02:44:40Z · Research date and publication date are separate.
- The Principles of Menu Engineering
BC Cook Articulation Committee / BCcampus · Canada; general accounting concepts adapted to U.S. owner context · Basic Kitchen and Food Service Management, copyright 2015
Published: Not stated · Reference period/event: Not applicable / not stated · Retrieved: 2026-09-24T02:44:40Z
Historical educational source, not a current U.S. price or demand benchmark. This article expands the cost scope explicitly; no source sales outcomes copied.
- Yield Testing
BC Cook Articulation Committee / BCcampus · Canada; general costing method · Basic Kitchen and Food Service Management, copyright 2015
Published: Not stated · Reference period/event: Not applicable / not stated · Retrieved: 2026-09-24T02:44:40Z
No source yield example or dated ingredient price is used as a restaurant default. Actual recipe yield must be measured locally.