Build a prep log that can explain both waste and stockouts
Count what was made, what left the station, and when the item was unavailable. A sales total alone cannot tell you how much to prepare next time.
View chart data and method
Illustrative count reconciliation. An ending count says nothing about whether food may be kept or served later.
hypothetical scenario · portions
| Scenario / series | Value |
|---|---|
| Sold | 32 |
| Discarded | 4 |
| Ending count | 4 |
40 prepared = 32 sold + 4 discarded + 4 ending count
One hypothetical batch, no transfers or staff meals. Follow established food-safety procedures independently.
Source references: Original illustrative calculation; not observed results.
Give every discard a reason and a unit
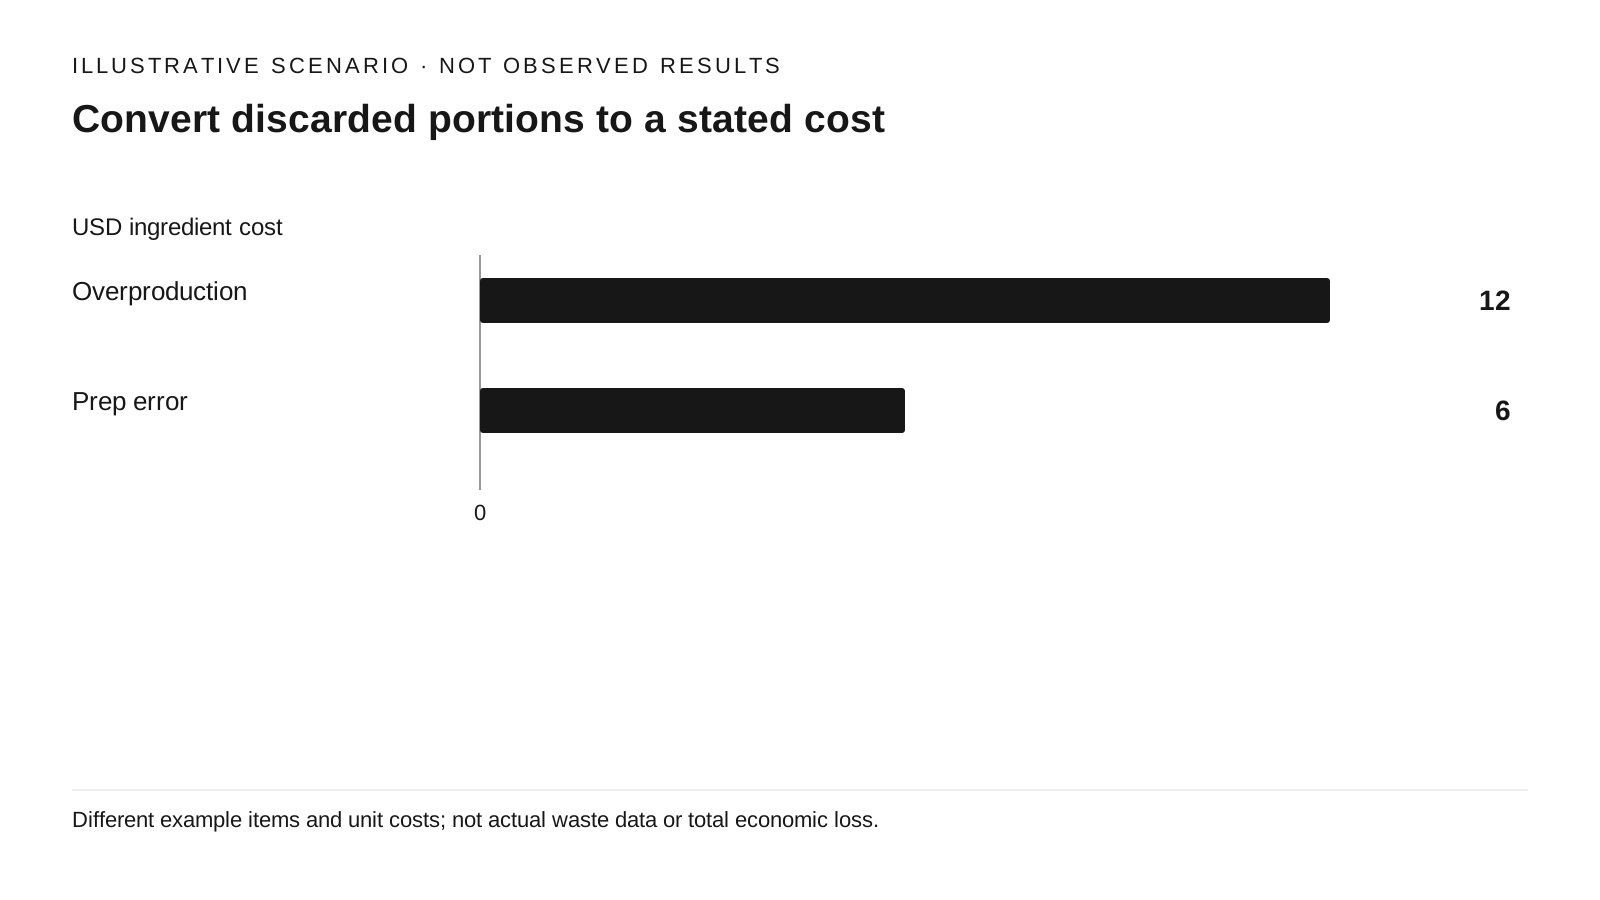
View chart data and method
hypothetical scenario · USD ingredient cost
| Scenario / series | Value |
|---|---|
| Overproduction | 12 |
| Prep error | 6 |
6 portions×$2=$12; 2 portions×$3=$6
Different example items and unit costs; not actual waste data or total economic loss.
Source references: Original illustrative calculation; not observed results.
EPA's food-service toolkit recommends tracking the amount, type, and reason for wasted food. Its page, updated March 22, 2026, distinguishes a one-time assessment from ongoing tracking and says its tool works best with at least two weeks of daily records. That supports gathering a baseline; it does not establish a universal two-week demand forecast or promise a saving for your restaurant. [S1]
For an owner-run starter log, choose a few costly or frequently unavailable prep items. Use one unit per item: portions, weight, or containers with a documented weight. Record date, daypart, item, batch time, quantity discarded, reason, and the cost basis. Separate overproduction from preparation error, guest plate leftovers, and an unexplained difference. These categories suggest different investigations.
In a hypothetical week, six discarded portions at $2 ingredient cost equal $12 of overproduction loss; two at $3 equal $6 of preparation-error loss. The lower quantity is not necessarily the lower priority once cost and cause differ. Ingredient cost is a useful first measure, but it excludes paid preparation time, packaging, disposal charges, and forgone sales. Never use menu price as if it were the same measure.
Reconcile quantities before inferring demand
For each observation window, write beginning count plus production plus transfers in, less portions sold, transfers out, staff meals or samples, and discards. The result should match the ending physical count. Keep an unexplained-difference field instead of forcing the balance to work. If recipes use different portion sizes, first translate them to the same unit.
The 40-portion illustration has no opening inventory or other uses: 32 sold, four discarded, four remaining when counted. Do not classify the remaining four as waste until their actual disposition is known. A count is an inventory observation, not permission to hold, reuse, cool, or re-serve food. Existing food-safety procedures determine disposition; this article supplies no holding-time or temperature rules.
Record when an item becomes unavailable and available again, including whether the online menu was disabled. Add known declined requests, substitutions, and canceled orders without guest identifiers. Three guests explicitly asking for an unavailable item establish three observed requests; they do not reveal silent abandonment or prove that all three would have completed a purchase.
A lower sales count can hide a stronger selling pace
View chart data and method
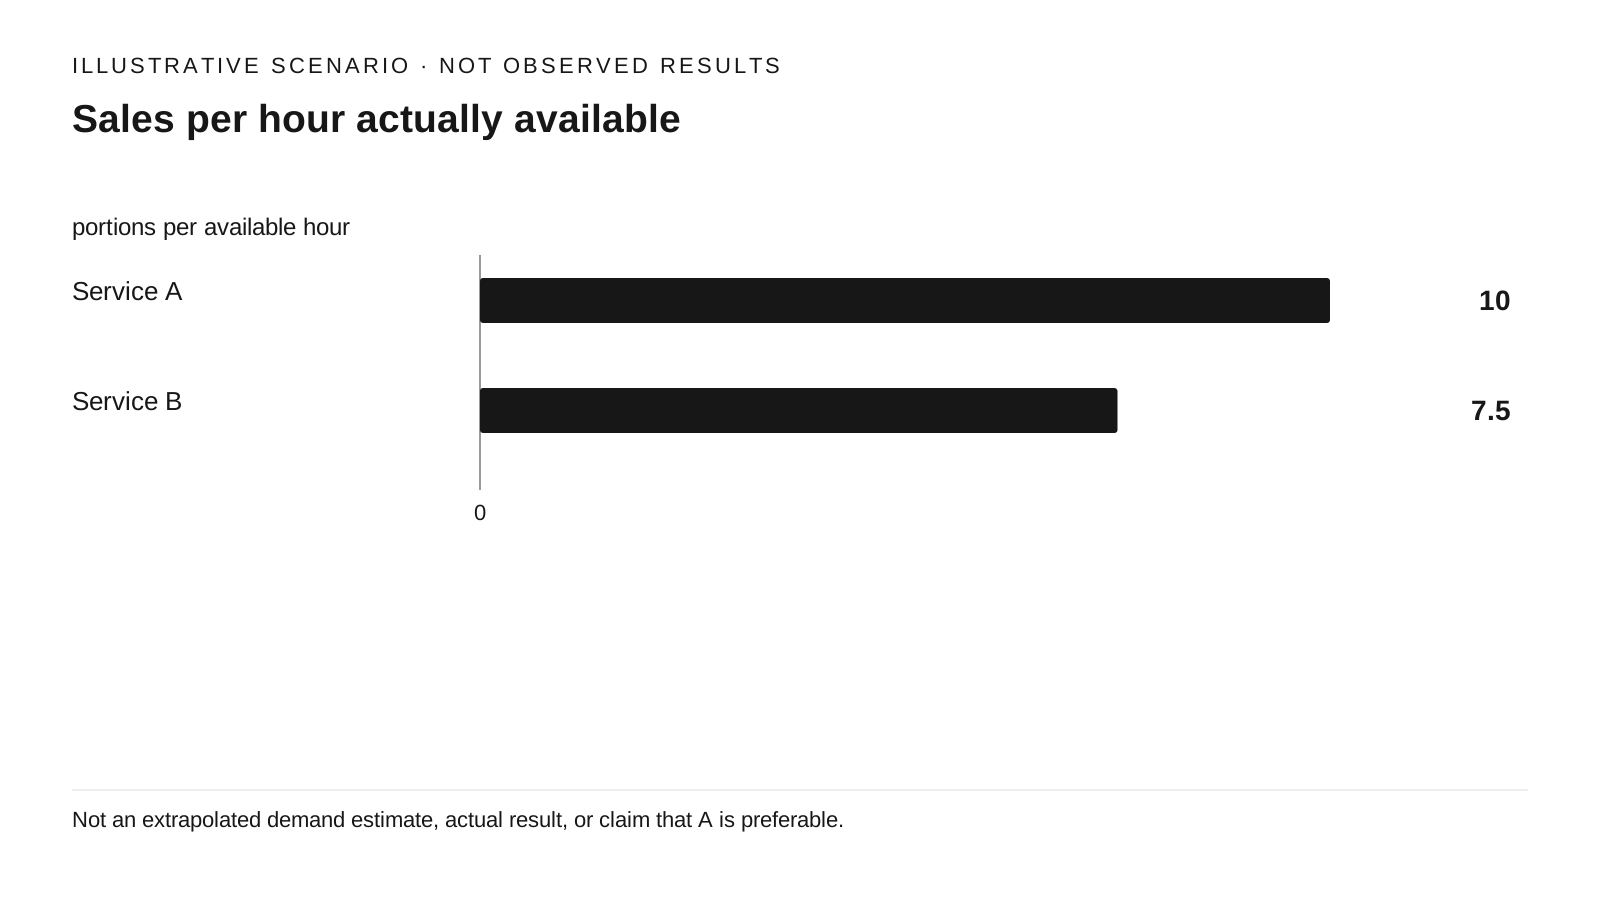
hypothetical scenario · portions per available hour
| Scenario / series | Value |
|---|---|
| Service A | 10 |
| Service B | 7.5 |
A=20/2=10; B=30/4=7.5
Not an extrapolated demand estimate, actual result, or claim that A is preferable.
Source references: Original illustrative calculation; not observed results.
Imagine one service selling 20 portions during two available hours before a stockout, and another selling 30 during four available hours. The raw sales count favors the second day. The observed pace while available is 10 versus 7.5 portions per hour. Neither rate is a reliable all-evening forecast if demand is concentrated at the peak.
The useful comparison is availability within similar time blocks, alongside covers or total orders, weather, events, promotions, and competing menu items. If a special sells out at 6:30 p.m., comparing it with a fully available 5–9 p.m. item can lead you to reduce the wrong prep quantity. If total orders were lower, the same stockout may have a different explanation.
Treat a stockout interval as incomplete demand information. Increasing every future batch to cover imagined lost sales can simply create more discards. Try a smaller, observable adjustment to an initial quantity or replenishment time, provided the workflow and established handling procedures support it. Evaluate replenishment labor and station congestion along with ingredient loss.
Choose a test that can fail visibly
Gather a baseline across comparable weekdays and dayparts before changing the selected item. Our suggested test is to change only one factor, such as the first batch quantity, while recording replenishment timing. Write the decision rule before the test: lower ingredient discard cost is acceptable only if the owner's chosen availability and service standards are also met. There is no universal acceptable waste or stockout threshold here.
Review the log after each service for missing entries, then compare several matched services rather than the best single shift. Show discarded cost per 100 total orders, unavailable minutes during the advertised window, observed unfilled requests, and extra prep minutes separately. They have different units and should not be added into a made-up score.
Keep the change only if the records support it after accounting for order volume and unusual events. If waste falls but unavailable minutes rise, preserve that tradeoff in the decision record. If the quantity ledger will not reconcile, fix the measurement process before claiming the new prep plan worked.
Sources & Verified On
Some editorial visuals may be AI-generated and are illustrative, not source evidence.
Verified: 2026-09-24 · Research date and publication date are separate.
- Tools for Preventing and Diverting Wasted Food
U.S. Environmental Protection Agency · United States
Published: Not stated · Reference period/event: Toolkit linked on page dates to March 2014; page last updated March 22, 2026 · Retrieved: 2026-09-24
Not evidence of savings at a particular restaurant. Page update is not the original toolkit publication date. No food-safety limits or local handling advice are taken from this source.