Compare dine-in, direct, and delivery by what one order leaves
Use the same basket and cost boundaries first. Then ask whether the channel adds an order, moves an existing one, or consumes scarce kitchen capacity.
View chart data and method
Illustrative: $6 food cost; $1 packaging for takeout; 2.9%+$0.30 assumed payment cost for dine-in/direct; 25% assumed all-in platform fee. No added labor or other costs modeled.
hypothetical scenario · USD per order
| Scenario / series | Value |
|---|---|
| Dine-in | 13.12 |
| Direct pickup | 12.12 |
| Platform delivery | 8 |
Dine-in:20-6-(20*0.029+0.30)=13.12;direct:20-6-1-(20*0.029+0.30)=12.12;platform:20-6-1-20*0.25=8
Original illustrative terms, not any vendor's quoted rate or restaurant's actual margin. Tax, tips, refunds, discounts, fixed cost and additional labor are excluded unless stated.
Source references: Original illustrative calculation; not observed results.
Make the comparison's boundaries visible
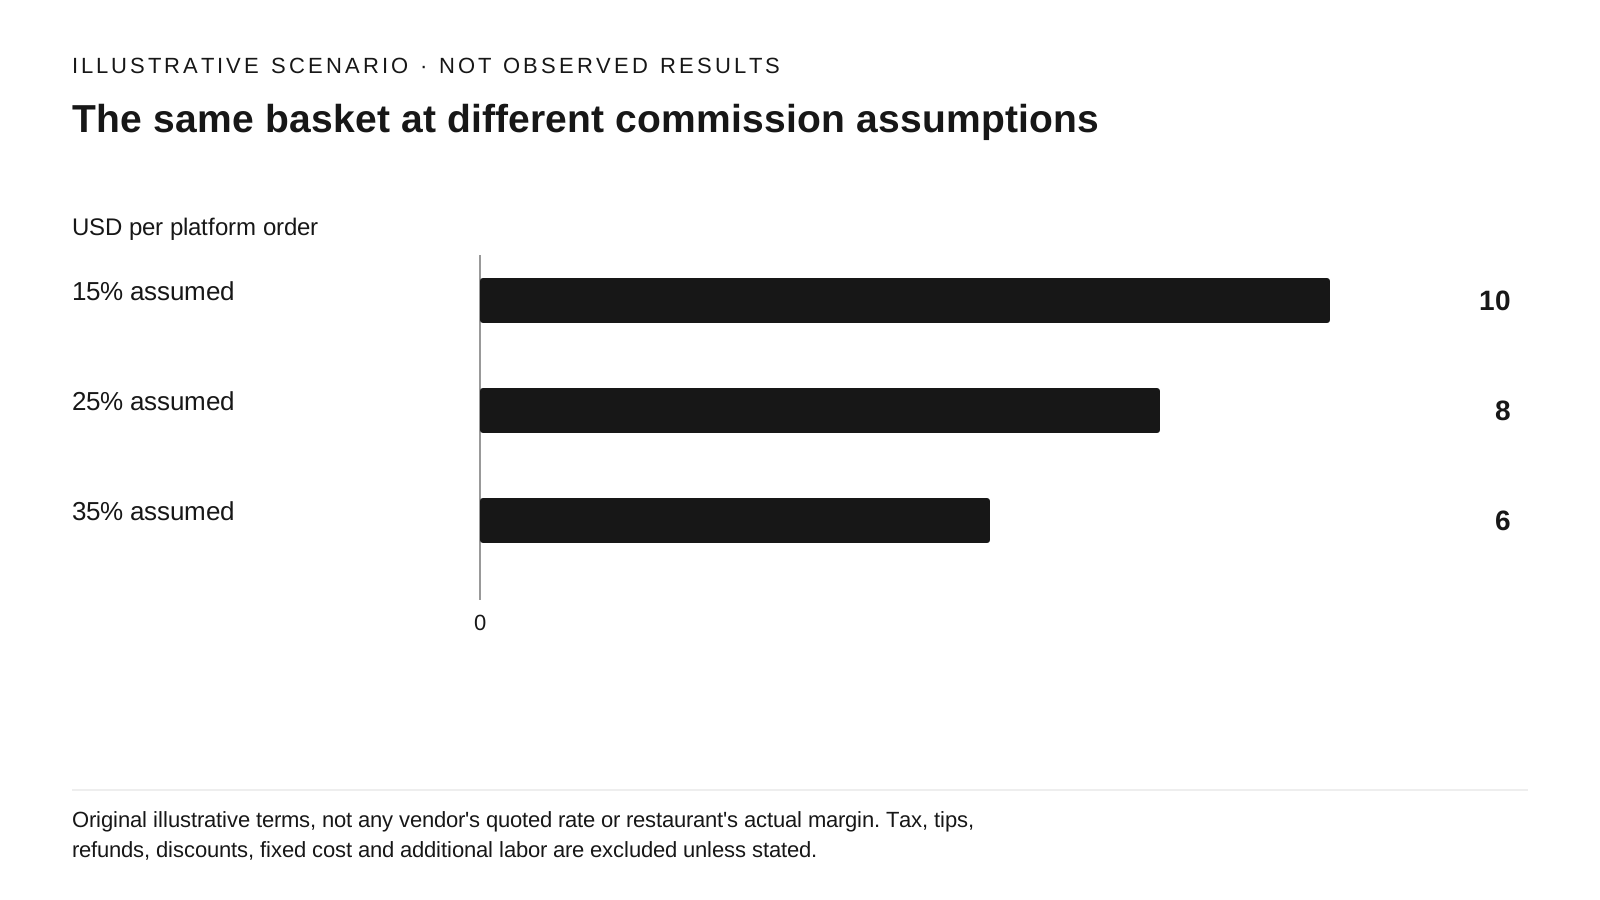
View chart data and method
hypothetical scenario · USD per platform order
| Scenario / series | Value |
|---|---|
| 15% assumed | 10 |
| 25% assumed | 8 |
| 35% assumed | 6 |
20-6-1-(20*r), r=0.15,0.25,0.35
Original illustrative terms, not any vendor's quoted rate or restaurant's actual margin. Tax, tips, refunds, discounts, fixed cost and additional labor are excluded unless stated.
Source references: Original illustrative calculation; not observed results.
Begin with a basket rather than an average check from three different customer populations. Use the same food items and quantities, record each channel's actual food subtotal, and exclude sales tax and tips. Subtract food, packaging, seller-funded discounts, transaction costs, and the labor or other expenses that genuinely vary with those orders.
Contribution is revenue less variable cost, before fixed costs. [S1] It is not restaurant net profit. The distinction lets an owner compare a channel's transaction economics while keeping rent, existing salaries, and channel subscriptions visible in a separate period-level view.
A real fee bundle can change the calculation. DoorDash's US merchant page states that its Marketplace commission covers payment processing, while its Online Ordering service has payment fees. [S2] This is one documented example of why the fee label matters. Check the restaurant's own contract and statement; the hypothetical rates in this article are not quoted vendor terms.
Match like-for-like costs before ranking channels
In our original example, every channel sells the basket for $20 and incurs $6 food cost. Dine-in has no modeled takeout packaging. Direct pickup and platform delivery each use $1 packaging. An illustrative 2.9% plus $0.30 payment fee applies to dine-in and direct; platform delivery instead has a 25% all-in transaction fee.
The resulting contributions are $13.12, $12.12, and $8. Those numbers deliberately omit added labor, refunds, other variable supplies, and monthly costs so the mechanics are visible. They are not claims about a typical restaurant. Add the omitted costs before using the comparison to make a decision; table service may require costs that takeout does not.
Separate the merchant-funded part of a discount from a platform-funded credit, and confirm whether the commission base is before or after discount. Record that base in the calculation. A payout is not a substitute for this bridge because it may also contain taxes, prior-period adjustments, refunds, or unrelated deductions.
Ask which order would happen without the channel
View chart data and method
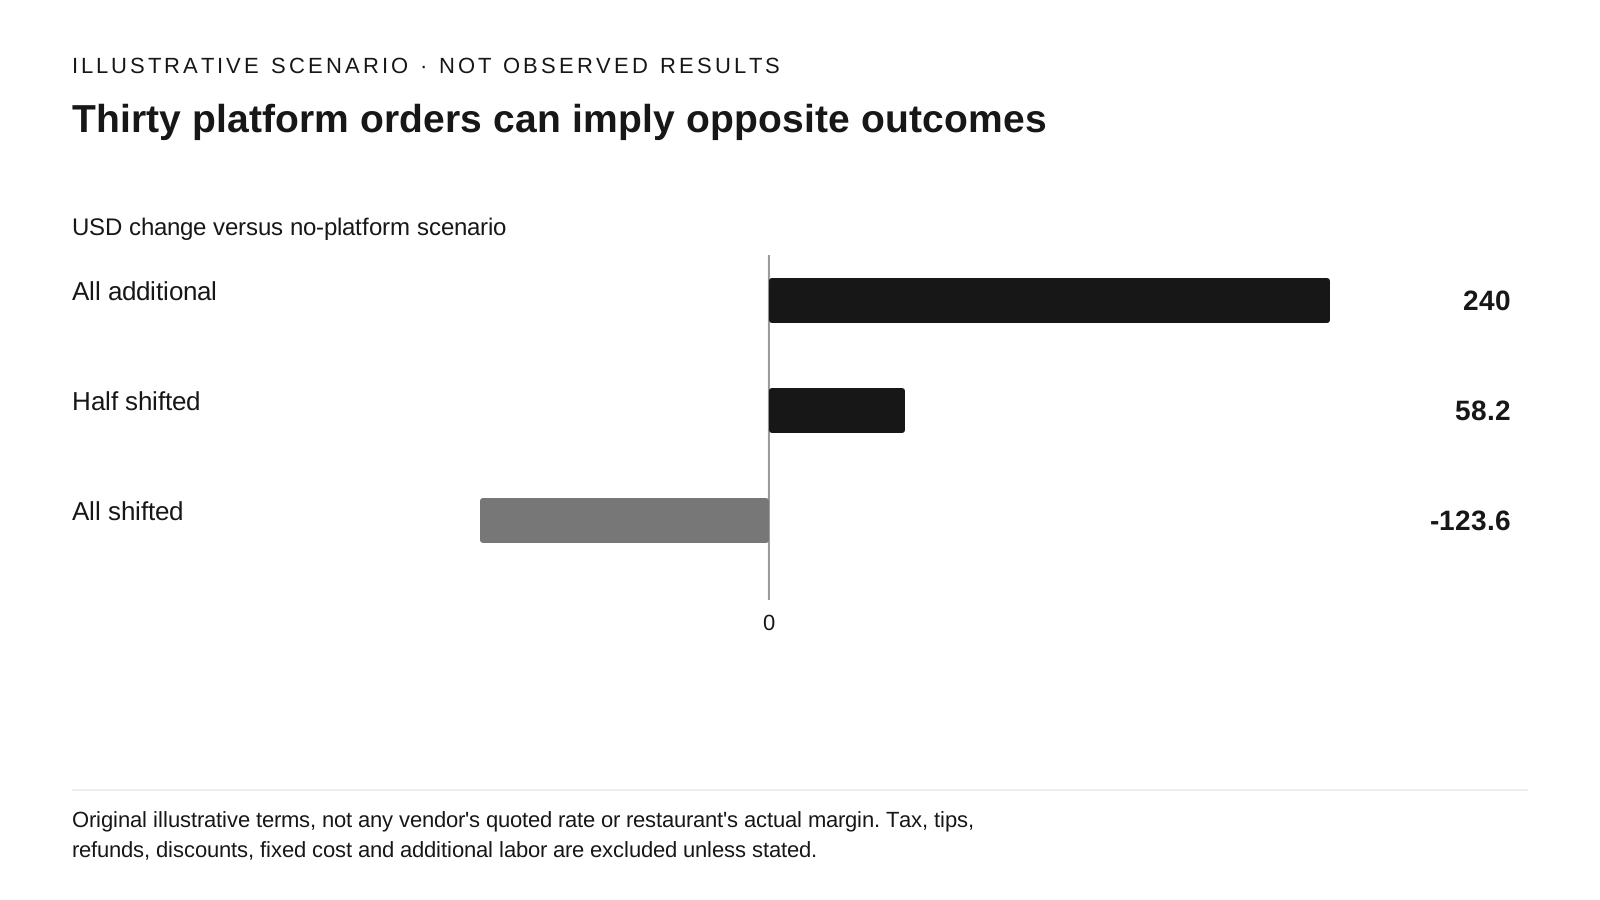
hypothetical scenario · USD change versus no-platform scenario
| Scenario / series | Value |
|---|---|
| All additional | 240 |
| Half shifted | 58.2 |
| All shifted | -123.6 |
30*8=240;15*8+15*(8-12.12)=58.20;30*(8-12.12)=-123.60
Original illustrative terms, not any vendor's quoted rate or restaurant's actual margin. Tax, tips, refunds, discounts, fixed cost and additional labor are excluded unless stated.
Source references: Original illustrative calculation; not observed results.
If 30 platform orders at $8 contribution are entirely additional and fit into spare capacity, they add $240 before any extra monthly cost. If all 30 replace direct orders worth $12.12 each, the change is 30 × ($8 − $12.12) = −$123.60. A half-additional, half-shifted scenario adds only $58.20. The observed platform order count is the same in all three cases.
Capacity adds another comparison. OpenStax discusses contribution per unit of a scarce resource. [S3] For a restaurant, a measured constraint might be grill minutes, oven space, or packing-station time. If extra delivery work displaces other profitable work at the peak, compare what each competing order contributes per minute of that actual constraint. Do not assume that every employee minute is the bottleneck.
Price can recover arithmetic margin but does not guarantee demand. With the example's $6 food, $1 packaging, and 25% fee, matching $12.12 contribution requires a theoretical price of ($12.12 + $6 + $1) ÷ 0.75 = $25.4933… . A $25.50 price reaches at least the target before fee-rounding details. Whether guests will buy at that price remains unmeasured.
Run an order comparison and a monthly scenario separately
Take a small set of common baskets and reconcile the calculation to actual statements. Save the fee base, discount funding, packaging specification, and any added labor assumption with each case. If the agreement is unclear, leave that input unresolved and run both plausible fee-base cases instead of silently choosing the favorable one.
Use the Delivery Contribution & Menu Markup Calculator for the order-level comparison and target-price arithmetic. Then vary monthly order volume, incremental-versus-shifted mix, and channel-specific fixed costs. PP-03 explains why a monthly fee should not become a changing marginal cost whenever volume changes.
Choose the operational response from the constraint: adjust pricing or menu mix when per-order economics are weak; test off-peak availability when capacity is the issue; investigate source and channel migration when incremental demand is unknown. No source used here establishes that a particular platform will generate profitable incremental orders for your restaurant.
Sources & Verified On
Some editorial visuals may be AI-generated and are illustrative, not source evidence.
Verified: 2026-09-24T02:44:57Z · Research date and publication date are separate.
- Contribution margin per unit, ratio, and total
OpenStax, Rice University · United States; general accounting principles
Published: 2019-02-14 · Reference period/event: Not applicable / not stated · Retrieved: 2026-09-24T02:44:57Z
General accounting reference, not a restaurant loyalty experiment. No textbook figures, worked examples, or extended text reused.
- DoorDash Commission Rates & Pricing
DoorDash · United States; Partnership Plans eligibility stated on page · US merchant pricing page retrieved 2026-09-24; no revision date displayed
Published: Not stated · Reference period/event: Not applicable / not stated · Retrieved: 2026-09-24T02:44:57Z
Vendor summary, not an executed merchant contract. Plan eligibility and terms may change; check again before public release. No advertised sales-growth claims are used.
- Decisions when resources are constrained
OpenStax, Rice University · General accounting principles
Published: 2019-02-14 · Reference period/event: Not applicable / not stated · Retrieved: 2026-09-24T02:44:57Z
General method; no restaurant capacity or processing-time benchmark supplied. No source examples or graphics reproduced.