How much volume must a discount add—and how much can a price rise lose?
Solve the contribution equation before testing customer response. A ten-percent discount can require far more than ten-percent additional sales.

View chart data and method
Illustrative: the $16 item has $8 variable cost. A 10% price cut reduces contribution from $8 to $6.40, a 20% contribution decline.
hypothetical scenario · USD contribution per item
| Scenario / series | Value |
|---|---|
| $14.40 price | 6.4 |
| $16.00 price | 8 |
| $17.00 price | 9 |
price-8, for prices14.40,16,17
Original scenario, not a demand estimate. One item; $8 variable cost unless noted; tax and tips excluded. No change in fixed costs unless noted.
Source references: Original illustrative calculation; not observed results.
Preserve dollars of contribution, not dollars of revenue
View chart data and method
hypothetical scenario · whole items sold
| Scenario / series | Value |
|---|---|
| 10% discount | 125 |
| Original price | 100 |
| $1 increase | 89 |
ceil(800/6.40)=125;ceil(800/8)=100;ceil(800/9)=89
Original scenario, not a demand estimate. One item; $8 variable cost unless noted; tax and tips excluded. No change in fixed costs unless noted.
Source references: Original illustrative calculation; not observed results.
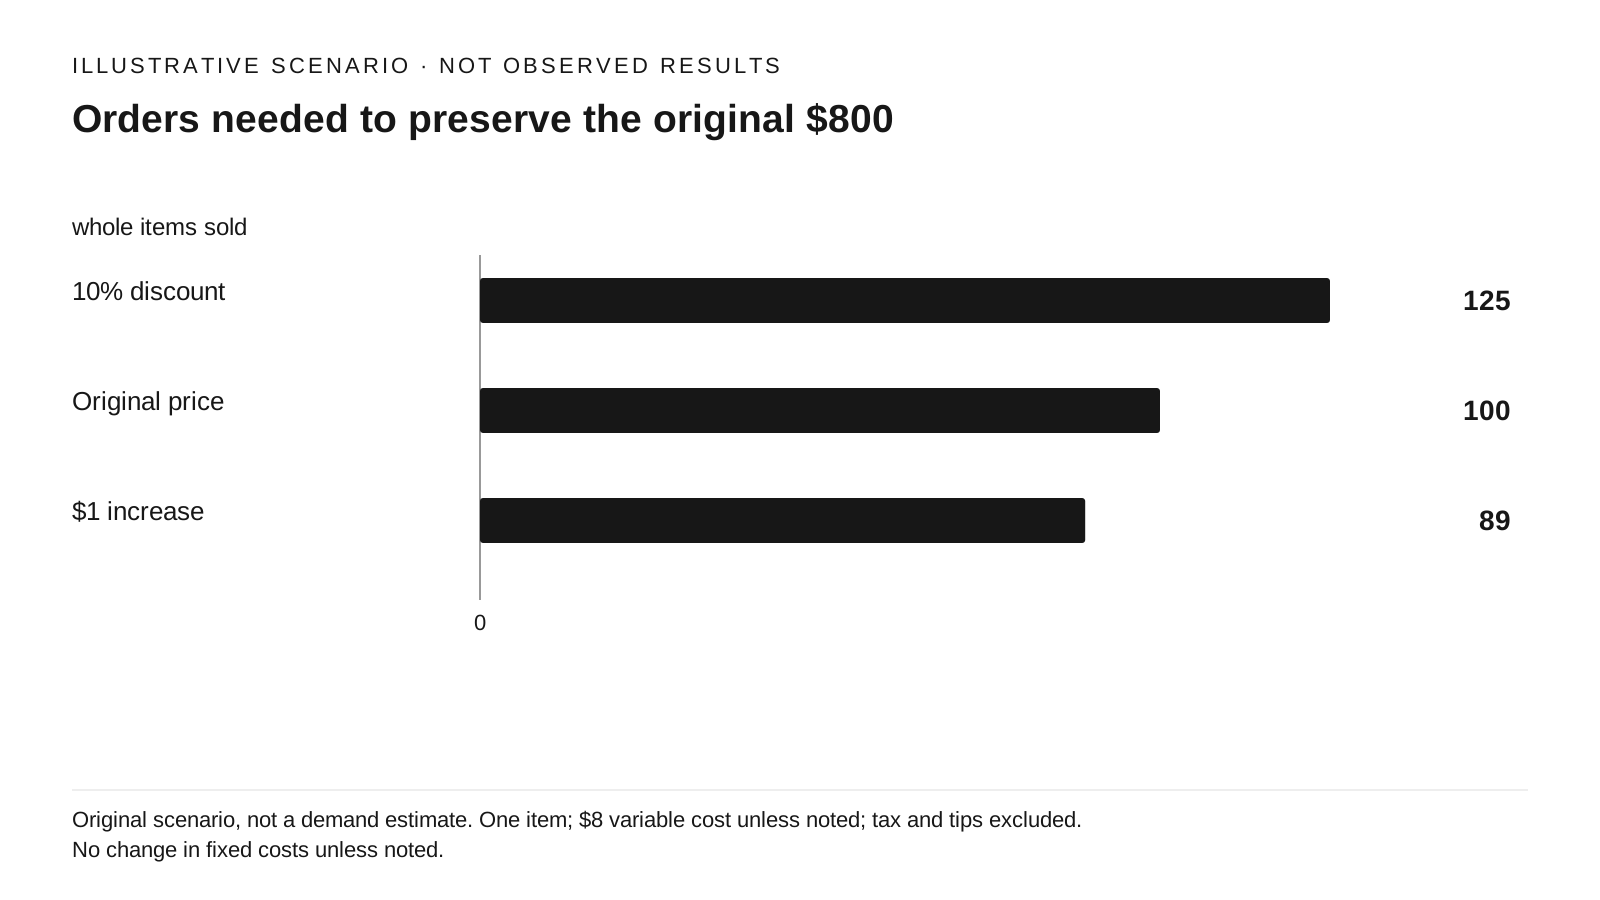
Suppose a restaurant sells 100 items at $16 each, with $8 variable cost per item. Its total contribution is 100 × ($16 − $8) = $800 before fixed costs. Cutting price by 10% to $14.40 reduces each item's contribution to $6.40. Recovering $800 requires 125 items, or 25% more volume.
The percentage trap is in the denominator. Price falls by 10%, but contribution falls by 20%. The required volume increase is $8 ÷ $6.40 − 1 = 25%. Selling 10% more items would produce only 110 × $6.40 = $704, leaving a $96 contribution shortfall.
SBA's break-even guidance separates price, unit variable cost, and fixed cost. [S1] Our calculation applies that same cost structure to a different question: matching an existing contribution amount after a price change. Matching $800 does not mean the restaurant breaks even; it still must cover whatever fixed costs sit below that contribution.
A price rise creates a tolerance, not a demand prediction
Raise the example price from $16 to $17 while keeping variable cost at $8. Contribution becomes $9. The continuous threshold is $800 ÷ $9 = 88.888… items; with whole items, 89 are required. Against the 100-item baseline, the restaurant can lose 11 whole item sales and still exceed the original contribution by $1.
That is not a forecast that only 11 guests will leave. Guests may change the item, skip an add-on, move to a different day, or stop ordering. OpenStax describes sensitivity analysis as changing price, volume, or cost assumptions to examine possible outcomes. [S2] Treat the calculations as boundaries for a test.
The baseline also needs care. A 100-item holiday week is a poor benchmark for a normal week. Choose a comparable period and hold the basket definition stable. If another item is substituted, the relevant outcome is the contribution of the whole affected basket or menu mix, not whether the repriced item's unit count recovers.
Added costs move the threshold again
View chart data and method
hypothetical scenario · whole items needed
| Scenario / series | Value |
|---|---|
| Base costs | 89 |
| +$50 period cost | 95 |
| +$1 unit cost | 100 |
ceil(800/9)=89;ceil((800+50)/9)=95;ceil(800/(17-9))=100
Original scenario, not a demand estimate. One item; $8 variable cost unless noted; tax and tips excluded. No change in fixed costs unless noted.
Source references: Original illustrative calculation; not observed results.
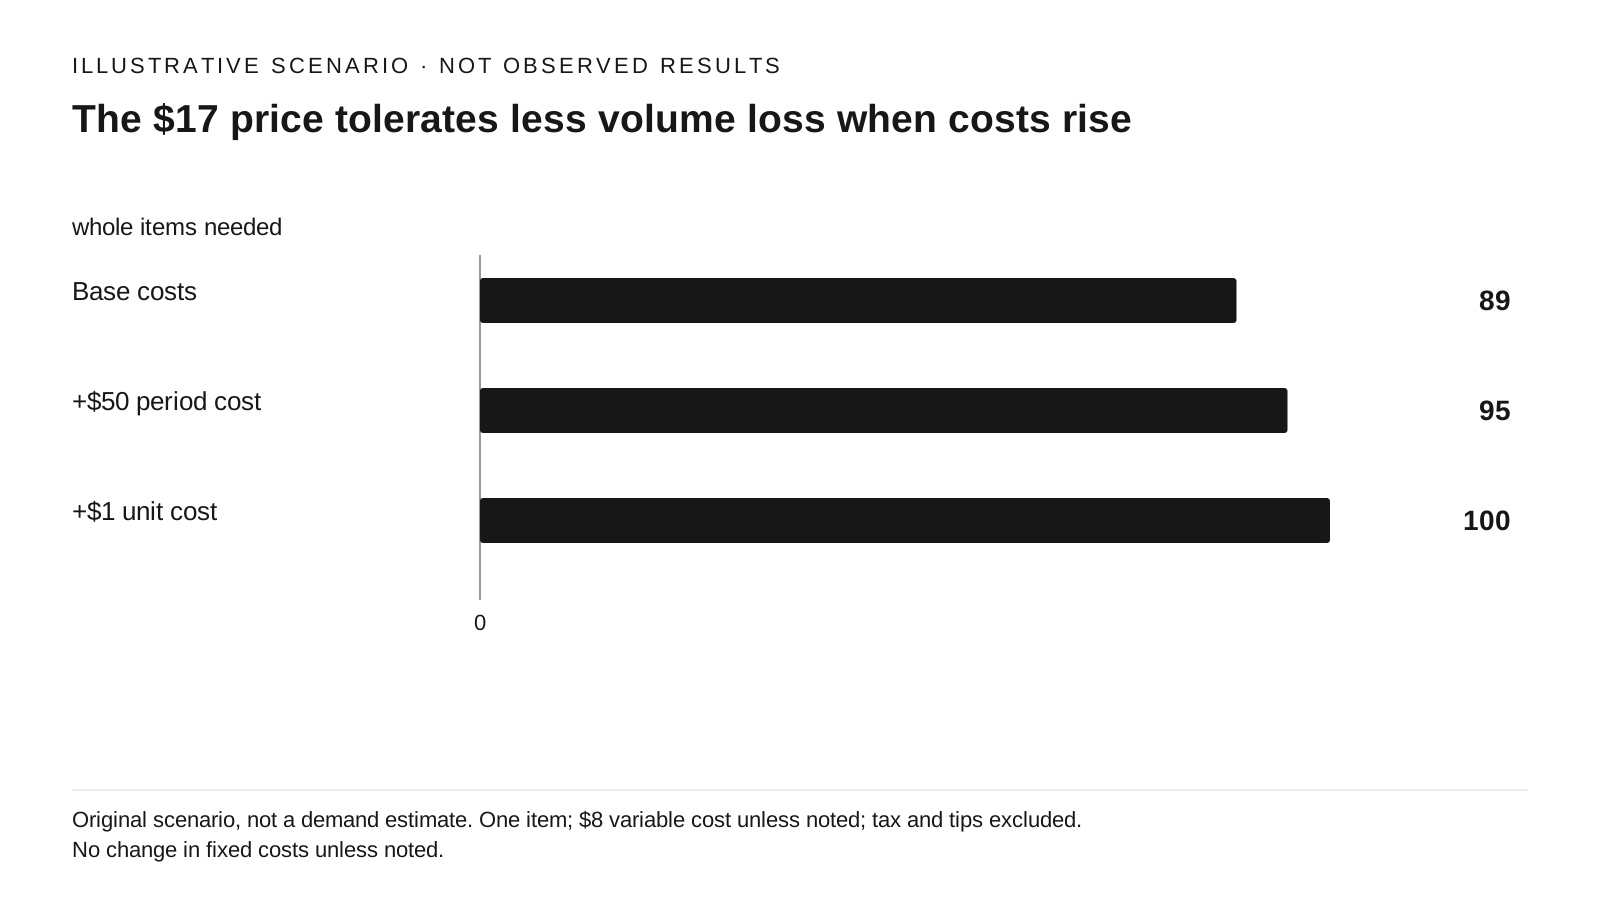
For positive new contribution m_new, the whole-item requirement is ceil((old quantity × old contribution + added fixed cost) ÷ m_new). Added fixed cost means the difference between new and old period costs, not all existing overhead. This formula preserves the previous result after that cost change.
If the $1 price increase also requires $50 of additional period cost, the target becomes $850 and 95 items are needed at $9 contribution. If variable cost instead rises from $8 to $9, the $17 item leaves $8 and again needs 100 items, with no fixed-cost change. A higher menu price can therefore offer less volume protection than the headline suggests.
If the extra discounted volume needs an added shift or generates more waste, the $6.40 assumption may no longer hold. Recalculate using that new operating range. If contribution per additional unit is zero or negative and the target is positive, no finite increase in identical units will recover it; dividing by zero or presenting a negative sales target would mislead.
Turn the threshold into a limited, observable decision
List the old and proposed net price, recipe quantity and yield, packaging, transaction charges, item-specific discount, and truly variable labor. Percentage fees need to be recomputed at the new price; a fixed fee per order belongs to the order, not automatically to every item in a multi-item basket. Keep taxes and tips outside the food-price comparison.
Use the Delivery Contribution & Menu Markup Calculator to compare channel-level assumptions, then apply the contribution-preservation formula to the chosen item or basket. Write down which cost inputs might change with volume. Do not adopt the illustrative prices as recommended menu prices.
For a limited price test, monitor unit count, total basket contribution, refunds, substitutions, service time, and repeat visits over comparable periods. Record other changes that could explain the result. Continue, revise, or stop based on contribution and operating performance; an increase in revenue alone cannot establish that the price decision improved the business.
Sources & Verified On
Some editorial visuals may be AI-generated and are illustrative, not source evidence.
Verified: 2026-09-24T02:44:57Z · Research date and publication date are separate.
- Break-even point
U.S. Small Business Administration · United States · Page displays Last updated October 3, 2024; legacy official URL
Published: Not stated · Reference period/event: Not applicable / not stated · Retrieved: 2026-09-24T02:44:57Z
Generic one-product estimate, not a demand forecast. The page contains an erroneous quarterly-to-monthly divisor in its fixed-cost example; that example is not adopted.
- Break-even sensitivity analysis under changing business situations
OpenStax, Rice University · General accounting principles
Published: 2019-02-14 · Reference period/event: Not applicable / not stated · Retrieved: 2026-09-24T02:44:57Z
Accounting scenarios do not estimate demand response. No original textbook cases or figures reused.